11.1. Plotting in XmGrace
A high-level Python interface to the Grace plotting package XmGrace
One line command plotting: plot of numpy arrays and dataArrays without predefining Data or Symbol objects.
symbol, line and error are defined by list arguments as line=[1,0.5,3]
Older functionality still works and can be used for more sophisticated output.
How to write special symbols and more see Tips.
Example
import jscatter as js
data=js.dL(js.examples.datapath+'/iqt_1hho.dat')               #read data from test directory into dataList
# open plot with fixed size of 2x3 inch or 2*300x3*300 pixel
p=js.grace(2,1)
p.multi(1,2)
#
p[0].plot(data[:8:2],symbol=[-1,1,-1,''],line=[1,2,''],legend='Q=$q')
p[1].plot(data[1:8:2],sy=[-1,1,-1],li=-1, legend='Q=$q')
#
 # make axes, legend, title, and subtitle to get nice plot
p[0].yaxis(min=0.09,max=1.1,scale='l',label='I(Q,t)/I(Q,0)',charsize=1.50,ticklabel=['power',0,1.3])
p[0].xaxis(min=0.0,max=150,label='fouriertime t / ns ',charsize=1.50)
p[1].xaxis(min=0.9,max=150,scale='log',label='fouriertime t / ns ',charsize=1.50)
p[0].legend(x=110,y=1)
p[0].title(r'An example for the intermediate scattering function in \n Neutron Spinecho Spectroscopy',size=1)
p[0].title('This is GraceGraph 1',size=2)
p[1].title('This is GraceGraph 2',size=2)
p[0].subtitle('colors of lines are sync to symbol color')
# add a text
p[1].text(r'Here we place a text just as demo\n at the last point of this dataset',x=1.2,y=0.3,charsize=1)
# p.save('testdata.agr') #as grace file
# p.save(js.examples.imagepath+'/Graceexample.jpg',format='jpeg',size=[2,1.33]) #as jpg file
some examples using GracePlot
Above;
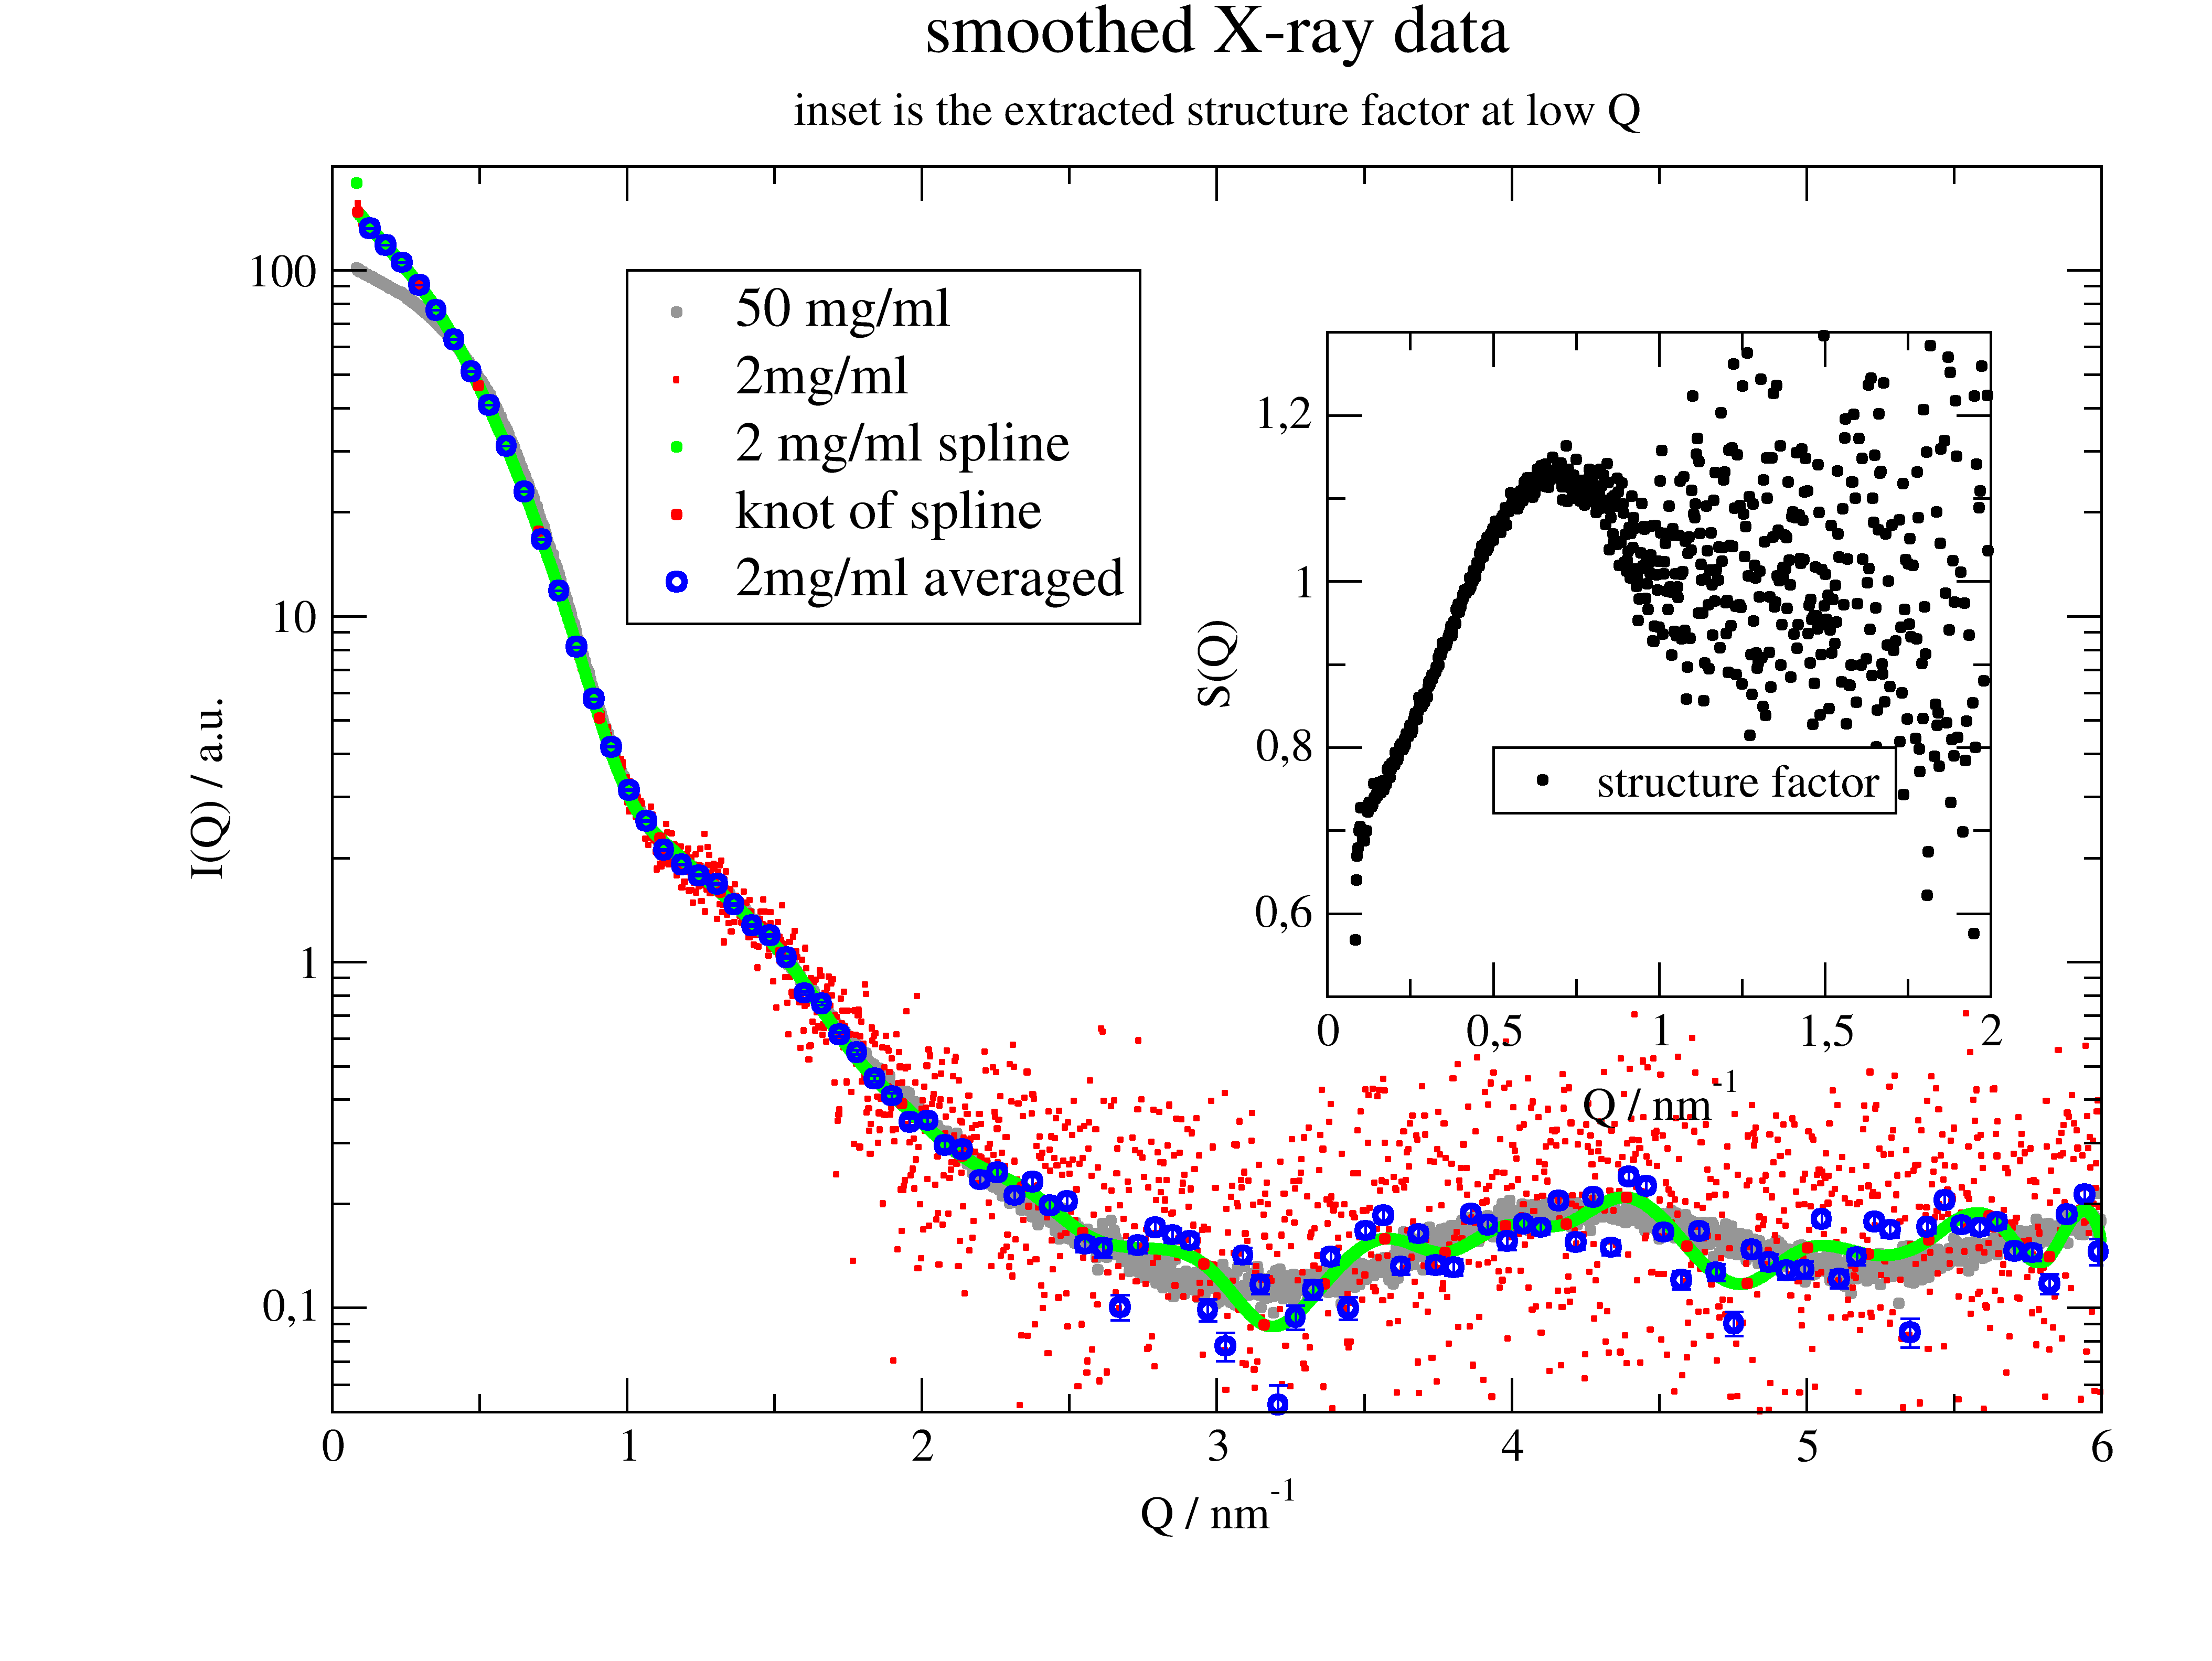
Smoothed Xray ;
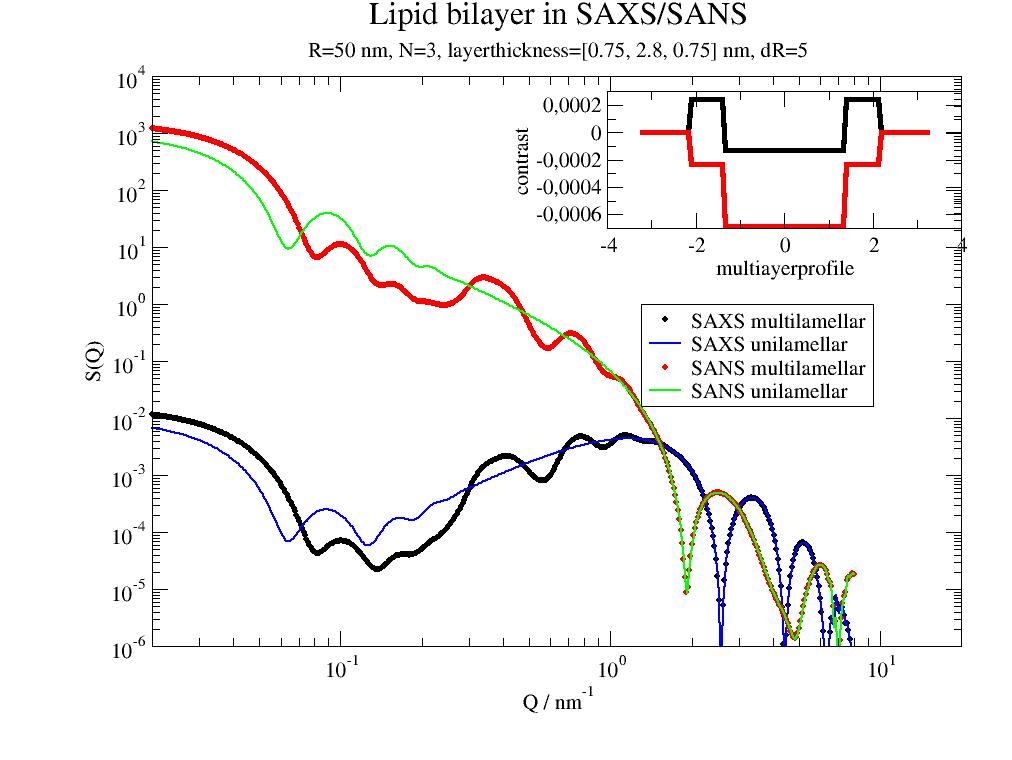
multilamellarVesicles()

Originally, this code of GracePlot started out from: Nathaniel Gray <n8gray@caltech.edu>, updated by Marcus H. Mendenhall, MHM ,John Kitchin, Marus Mendenhall
original source -> sourceforge.net/projects/graceplot/ 2014 and according to that site: License: GNU General Public License version 2.0 (GPLv2)
Consequently this file is still under GNU General Public License version 2.0 (GPLv2)
2019 changed some things to be only python 3 compatible
Ralf Biehl JCNS1 & ICS1 Forschungszentrum Juelich 2014-2019
- jscatter.graceplot.on_off(flag)[source]
convert a bool into an xmgrace on/off string
- class jscatter.graceplot.createColorTable[source]
Bases:
object- property len
- property names
- property list
- assign(idx, rgb, name)[source]
- class jscatter.graceplot.symbols[source]
Bases:
object- none = np.int64(0)
- circle = np.int64(1)
- square = np.int64(2)
- diamond = np.int64(3)
- triangle_up = np.int64(4)
- triangle_left = np.int64(5)
- triangle_down = np.int64(6)
- triangle_right = np.int64(7)
- plus = np.int64(8)
- cross = np.int64(9)
- star = np.int64(10)
- character = np.int64(11)
- class jscatter.graceplot.lines[source]
Bases:
object- none = np.int64(0)
- solid = np.int64(1)
- dotted = np.int64(2)
- dashed = np.int64(3)
- long_dashed = np.int64(4)
- dot_dashed = np.int64(5)
- class jscatter.graceplot.frames[source]
Bases:
object- closed = 0
- halfopen = 1
- breaktop = 2
- breakbottom = 3
- breakleft = 4
- breakright = 5
- jscatter.graceplot.inheritDocstringFrom(cls)[source]
- exception jscatter.graceplot.Disconnected[source]
Bases:
ExceptionThrown when xmgrace unexpectedly disconnects from the pipe.
This exception is thrown on an EPIPE error, which indicates that xmgrace has stopped reading the pipe that is used to communicate with it. This could be because it has been closed (e.g., by clicking on the exit button), crashed, or sent an exit command.
- class jscatter.graceplot.GraceGraph(grace, gID, xmin=0.15, xmax=0.95, ymin=0.15, ymax=0.9)[source]
Bases:
objectclass for handling GraceGraph
- Parameters:
- gIDinteger
Graph ID
- xmin,xmax,ymin,ymaxfloat default 0.15,0.95,0.15,0.88
position of edges in plot in relative view coordinates
- grace()[source]
- autoscale(axis=None)[source]
autoscales axes
- axis‘x’,’y’,None
None, scale all axes, otherwise if it is ‘x’ or ‘y’ scale that axis
- redraw(*args, **kwargs)[source]
redraw Graph
pass through to our GraceGraph instance
- hold(onoff=None)[source]
Turn on/off overplotting for this graph.
Call as hold() to toggle, hold(1) to turn on, or hold(0) to turn off. Returns the previous hold setting.
- title(title=None, font=None, size=None, color=None)[source]
Sets the graph title.
- Parameters:
- titlestring
Title string
- font
Font of title
- sizefloat
Size of title
- colorinteger
Color of title
- subtitle(subtitle=None, font=None, size=None, color=None)[source]
Sets the graph subtitle
see title
- gen_axis(axis_prefix, ax_min=None, ax_max=None, scale=None, invert=None, formula=None, offset=None, label=None, ticklabel=None, charsize=None, size=None, tick=None, bar=None, autotick=True)[source]
Format of axis
- Parameters:
- axis_prefix{‘x’,’y’}
determines axis
- ax_min,ax_maxfloat
min and max of axis
- scale{‘normal’, ‘logarithmic’, or ‘reciprocal’ or respectivly ‘n’,’l’,’r’}
sets type of axis
- labelstring, list or Label object
Label of the axis; see Label object.
string: this is the label string.
list = [label string, charsize, place, color, location]
place : ‘normal’,’both’,’opposite’
location : [parallel, perpendicular] offset from axis center. defauls [0,0.08]
- invert{True,False}
invert axis
- formulagrace equation
formula for ticklabel calculation eg. for rescaling.
$t is label -> scaling as “$t*1e5”
- charsize,sizefloat
determines character size, default 1
- offsetlist of float
determines the position of the normal and opposite axis position
- autotickbool
autoticking
- tickTick object or list, False, True
list of [major tick distance , minorticks number, majorsize, minorsize, position]
position as one of ‘normal’,’both’,’opposite’ (first letter is enough)
False, True switch Ticks on and off
see Tick for more
- ticklabelfloat, list, tickLabel object
With [format,precision,charsize,placeon] or a shortcut
format: ‘decimal’,’exponential’,’general’,’power’,’scientific’
precision : integer
charsize : float
placeon : ‘normal’,’both’,’opposite’
Shortcuts:
‘on’, ‘off’,1,0: switch ticklabel on/off
float: used as charsize
one of format strings: change format (‘power’,’scientific’ with precision=0’)
- bar‘on’,’off’,list or bar object
list=[onoff,color,linestyle,linewidth]
See bar object. ‘on’/’off’ switch on or off.
- xaxis(min=None, max=None, **kwargs)[source]
Format of axis
- Parameters:
- axis_prefix{‘x’,’y’}
determines axis
- ax_min,ax_maxfloat
min and max of axis
- scale{‘normal’, ‘logarithmic’, or ‘reciprocal’ or respectivly ‘n’,’l’,’r’}
sets type of axis
- labelstring, list or Label object
Label of the axis; see Label object.
string: this is the label string.
list = [label string, charsize, place, color, location]
place : ‘normal’,’both’,’opposite’
location : [parallel, perpendicular] offset from axis center. defauls [0,0.08]
- invert{True,False}
invert axis
- formulagrace equation
formula for ticklabel calculation eg. for rescaling.
$t is label -> scaling as “$t*1e5”
- charsize,sizefloat
determines character size, default 1
- offsetlist of float
determines the position of the normal and opposite axis position
- autotickbool
autoticking
- tickTick object or list, False, True
list of [major tick distance , minorticks number, majorsize, minorsize, position]
position as one of ‘normal’,’both’,’opposite’ (first letter is enough)
False, True switch Ticks on and off
see Tick for more
- ticklabelfloat, list, tickLabel object
With [format,precision,charsize,placeon] or a shortcut
format: ‘decimal’,’exponential’,’general’,’power’,’scientific’
precision : integer
charsize : float
placeon : ‘normal’,’both’,’opposite’
Shortcuts:
‘on’, ‘off’,1,0: switch ticklabel on/off
float: used as charsize
one of format strings: change format (‘power’,’scientific’ with precision=0’)
- bar‘on’,’off’,list or bar object
list=[onoff,color,linestyle,linewidth]
See bar object. ‘on’/’off’ switch on or off.
- yaxis(min=None, max=None, **kwargs)[source]
Format of axis
- Parameters:
- axis_prefix{‘x’,’y’}
determines axis
- ax_min,ax_maxfloat
min and max of axis
- scale{‘normal’, ‘logarithmic’, or ‘reciprocal’ or respectivly ‘n’,’l’,’r’}
sets type of axis
- labelstring, list or Label object
Label of the axis; see Label object.
string: this is the label string.
list = [label string, charsize, place, color, location]
place : ‘normal’,’both’,’opposite’
location : [parallel, perpendicular] offset from axis center. defauls [0,0.08]
- invert{True,False}
invert axis
- formulagrace equation
formula for ticklabel calculation eg. for rescaling.
$t is label -> scaling as “$t*1e5”
- charsize,sizefloat
determines character size, default 1
- offsetlist of float
determines the position of the normal and opposite axis position
- autotickbool
autoticking
- tickTick object or list, False, True
list of [major tick distance , minorticks number, majorsize, minorsize, position]
position as one of ‘normal’,’both’,’opposite’ (first letter is enough)
False, True switch Ticks on and off
see Tick for more
- ticklabelfloat, list, tickLabel object
With [format,precision,charsize,placeon] or a shortcut
format: ‘decimal’,’exponential’,’general’,’power’,’scientific’
precision : integer
charsize : float
placeon : ‘normal’,’both’,’opposite’
Shortcuts:
‘on’, ‘off’,1,0: switch ticklabel on/off
float: used as charsize
one of format strings: change format (‘power’,’scientific’ with precision=0’)
- bar‘on’,’off’,list or bar object
list=[onoff,color,linestyle,linewidth]
See bar object. ‘on’/’off’ switch on or off.
- xlimit(lower=None, upper=None)[source]
Convenience function to set the lower and/or upper bounds of the x-axis.
- ylimit(lower=None, upper=None)[source]
Convenience function to set the lower and/or upper bounds of the y-axis.
- xlabel(label, charsize=None)[source]
Convenience function to set the xaxis label charsize detemines charsize, default 1
- ylabel(label, charsize=None)[source]
Convenience function to set the yaxis label
- kill()[source]
Kill the plot
- clear(slice=slice(None, None, None), hold=0)[source]
Clear plot
- Parameters:
- sliceslice
Selects elements to delete. If ommited clear all. e.g. last for elements slice=slice(-4) don’t use slice extensivly as it could mess up.
- holdbool, default 0
Set/reset to hold lines.
- resetlast()[source]
Resets last used symbols and lines.
lastline=[1,0,0] lastsymbol=[1,0.5,1,0] lasterror=[0,0,0,0]
- legend(strings=None, x=None, y=None, boxcolor=None, boxpattern=None, boxlinewidth=None, boxlinestyle=None, boxfillcolor=None, boxfillpattern=None, font=None, charsize=None, color=None, length=None, vgap=None, hgap=None, invert=None, world_coords=True, offset=0, onoff=True, position=None)[source]
Place the legend in the plot or update it.
- Parameters:
- stringslist of strings,string, default=None
List of legend strings or one string. If None then self.legend_strings is used. self.legend_strings is build from legend attribute in plot
- offsetint, default 0
Which legend string to change if strings is single string >0 with offset shifted =<0 starting from last reverse order default 0 names last legend
- x,y: float
Position of the upper left corner of the box in data coordinates
- boxcolorint
Color of the legend box lines
- boxpatterninteger
Pattern of the legend box lines
- boxlinewidthfloat
Thickness of the line
- boxlinestyle,boxfillcolor,boxfillpatterninteger
As name says
- fontint
Is the font used in the legend
- charsizefloat
Size of the characters
- lengthint
Length of the box must be an integer
- vgapint
Vertical space between entries, can be a float
- hgapfloat
Horizontal spacing in the box can be a float
- invertbool, (True,False)
Order of entries, either in the order they are entered, or the opposite
- onoffbool
Show legend or not
- position‘ll’, ‘ur’, ‘ul’, ‘lr’
Legend position shortcut. Shortcuts for lower left, upper right, upper left, lower right.
- frame(type=None, linestyle=None, linewidth=None, color=None, pattern=None, backgroundcolor=None, backgroundpattern=None)[source]
Set frame type of graph
- Parameters:
- type[0,1,2,3,4,5] => closed,halfopen,breaktop,breakbottom,breakleft,breakright
Boxtype
- linestyleint
Linestyle; see plot
- linewidthfloat
linewidth; see plot
- colorint; see plot
Color
- patternint
Pattern
- backgroundcolorint
Color
- backgroundpatternint
Pattern
Notes
For the different types except of close the axis bar and tick marks need to be removed
- plot(*datasets, **kwargs)[source]
Plot data in xmgrace
e.g. p.plot(data,legend=’description’,symbol=[1,0.5,4],line=[1,2,2],errorbar=[0])
- Parameters:
- datasetsdataArray, dataList,numpy array, lists of them
Several of (comma separated) nonkeyword arguments or as list. If dimension of datasets is one a new Data object is created and plotted see Notes below for error plots.
- symbol,syint, list of float or Symbol object
[symbol,size,color,fillcolor,fillpattern,linewidth] as [1,1,1,-1,2];
single integer to chose symbol e.g.symbol=3; symbol=0 switches off
negative increments from last, non integer repeat last
symbol => 0-11 = ◦,☐,♢,▵,◁,▽,▷,+,×,☆,(11 is char)
size => size, a number e.g.0.5
color => int 0-16 = white,black,red,green,blue,ligth green,brown, darkgrey,violet,orange,magenta,grey
fillcolor=None : set color and adds fillpattern=1, non-integer syncs to symbol color
fillpattern=None 0 empty, 1 full, ….test it
linewidth 0.1-10 width of line for open symbols.
- line,liint, list of float or Line object
[linestyle,linewidth,color] as [1,1,’’];
negative increments;non integer as ‘’ repeats last
single integer to chose line line=1; line=0 switches of
linestyle int 1 normal, 2 dotted, 3 dashed, 4 long dashed, 5 dot-dashed
linewidth float goes from 0 to 6 in increasing thickness
color see symbol color, non-integer syncs to symbol color
- errorbar,erint or list of float or Errorbar object
[color,size,linewidth,riserlinewidth] as [1,1,1,1]; no increment, no repeat
color int see symbol color, non-integer syncs to symbol color
size float default 1.0 ; smaller is 0.5
linewidth float default 1.0
riserlinewidth float default 1.0
- legend,lestring
determines legend for all datasets
string replacement: attr name prepended by ‘$’ (eg. ‘$par’) is replaced by value str(par1.flatten()[0]) if possible. $(par) for not unique names
- comment: string
string determines comment for all datasets
for dataArray: list of attribute values is set as comment to ckeck use dataArray.resumeAttrTxt()
- autoscalebool
default True, False
- internal_autoscalebool
default True, False 10% border
- redrawbool
redraw
Notes
Plot types determined by dimension of dataset
- 1: dataset is type Data instances
See Data class for possibilities and original documentation.
- 2: dataset is numpy array; simplified version
Use slices like data_in_numpyarray[[0,3,2],:] to select columns to plot
len(array)= 2 XY
len(array)= 3 XYDY
len(array)= 4 XYDXDY
- 3: dataset is dataArray ; simplified version
attributes X,Y,eY,eX determine plot type if they exist. So set these before plot by dataset.setColumnIndex(3,4,7)
default is 0,1,2 for X,Y,eY, No eX
Slicing works too as for arrays.
For more complex plots use original Data class in 1. Old style plotting needs creation of GracePlot.Data objects like
d1=Data(x=x,y=y,symbol=GracePlot.Symbol(symbol=circle,fillcolor=red),line=GracePlot.Line(type=none))
or in short abreviation:
d1=Data(x=x,y=y,symbol=[-1,2,3,4],line=[1,2,3])
#plotted sets can be accessed by
p[0].datasets   as a list of Data objects
Examples
tX =np.r_[0:10]
tY=np.sin(tX)
data=np.c_[tX,tY,tY*0.05].T
p=s.grace()                    # open plot
# plot single column data tX,tY,teY
p.plot(tX,tY,legend='all 1D data',symbol=3,line=1,errorbar=[0])
#plot Data with arrray or dataList
p.plot(data,legend='description',symbol=[1,0.5,4],line=[1,2,2],errorbar=[0])
p.yaxis(label='whatever / m')  # change y label
p.legend()                     # show legends
- update_data(set_index, new_x=None, new_y=None, new_dylist=None)[source]
Efficiently update the data for a given data set. set length, etc. must not change!
- shiftbyfactor(xy=None, factor=None, repeat=None, scale='lin', xfactors=None, yfactors=None)[source]
Shift data consecutively by factors
Consecutively multiply by 2 as 2,4,6,8…. or with power laws.
- Parameters:
- xy‘xy’
Selector for x or y axis or both
- factorfloat
Shift factor
- repeatfloat default=number of sets in plot
Repeat number of times the factor 3 -> 2,4,6,2,4,6… for factor=2
- xfactorsarray or list
Factors as list, overrides factor and repeat
- yfactorsarray or list
Factors as list,overrides factor and repeat dylist is also shifted
- scale‘log’, other
If ‘log’ a factor**i is used for logarithmic scale all other factor*i is used
Notes
List is
factor*np.tile(np.r_[1:repeat+1],nSets)  lin scale
factor**np.tile(np.r_[1:repeat+1],nSets)  log scale
Create factors manually e.g. by
np.tile([1,2,3],3)         -->  array([1, 2, 3, 1, 2, 3, 1, 2, 3])
1.1**np.tile([1,1,2],3)    -->  array([1.1, 1.1, 1.21, 1.1, 1.1, 1.21, 1.1, 1.1, 1.21])
#for an inverse shifting
2*np.tile(np.r_[10:1:-1],3)-->  array([20, 18, 16, 14, 12, 10,  8,  6,  4, 20, 18, 16, 14, 12, 10,  8,  6, 4])
- autotick()[source]
- text(string=None, x=None, y=None, color=None, rot=0, font=None, just=None, charsize=None, world_coords=True)[source]
Writes text to graph at specified position.
- Parameters:
- stringstring
Text to print
- x,y: float
Coordinates are the cartesian coordinates of x,y axis
- colorint
Color
- rotfloat
Rotation angle
- fontint
Font as defined in default xmgrace plot
- just
Justification
- charsizefloat
Charsize
- world_coordsbool
World coordinates or viewport coordinates
Notes
Try in Gui for values.
- line(x1=None, y1=None, x2=None, y2=None, linewidth=None, linestyle=None, color=None, arrow=None, arrowtype=None, arrowlength=None, arrowlayout=None, world_coords=True)[source]
Draws line/arrow in plot.
- Parameters:
- x1,y1,x2,y2float
Start and end point. Coordinates are the cartesian cooridinates for a single graph.
- linewidthfloat
Width
- linestyleint
Style
- colorint
Color
- arrowint
Tells where the arrowhead is and is 0,1,2, or 3 for none, start, end, both ends
- arrowtypeint
Is for line (0), filled (1), or opaque (2), and only have an effect if the arrowlayout is not (1,1)
- arrowlayout[int,int]
Must be a list of 2 numbers, arrowlayout=(1,1) the first number relates to d/L and the second is I/L the meaning of which is unclear, but they affect the arrow shape.
Examples
import jscatter as js
import numpy as np

p = js.grace()
p.xaxis(min=0,max=1)
p.yaxis(min=0, max=1)
a,b,c = 0,0,1
for x,y in np.random.random(20).reshape([10,-1]):
   p[0].line(x,y,a,b,linewidth=c,linestyle=c,color=c,arrow=1)
   a,b = x,y
   c+=1
- SetView(xmin=None, ymin=None, xmax=None, ymax=None, aspect_scaled=True)[source]
this sets the viewport coords so they are available later for translating string and line coords.
- Parameters:
- xmin,xmax,ymin,ymaxfloat
view range
- aspect_scaledbool
aspect
- Plot(*datasets, **kwargs)
Plot data in xmgrace
e.g. p.plot(data,legend=’description’,symbol=[1,0.5,4],line=[1,2,2],errorbar=[0])
- Parameters:
- datasetsdataArray, dataList,numpy array, lists of them
Several of (comma separated) nonkeyword arguments or as list. If dimension of datasets is one a new Data object is created and plotted see Notes below for error plots.
- symbol,syint, list of float or Symbol object
[symbol,size,color,fillcolor,fillpattern,linewidth] as [1,1,1,-1,2];
single integer to chose symbol e.g.symbol=3; symbol=0 switches off
negative increments from last, non integer repeat last
symbol => 0-11 = ◦,☐,♢,▵,◁,▽,▷,+,×,☆,(11 is char)
size => size, a number e.g.0.5
color => int 0-16 = white,black,red,green,blue,ligth green,brown, darkgrey,violet,orange,magenta,grey
fillcolor=None : set color and adds fillpattern=1, non-integer syncs to symbol color
fillpattern=None 0 empty, 1 full, ….test it
linewidth 0.1-10 width of line for open symbols.
- line,liint, list of float or Line object
[linestyle,linewidth,color] as [1,1,’’];
negative increments;non integer as ‘’ repeats last
single integer to chose line line=1; line=0 switches of
linestyle int 1 normal, 2 dotted, 3 dashed, 4 long dashed, 5 dot-dashed
linewidth float goes from 0 to 6 in increasing thickness
color see symbol color, non-integer syncs to symbol color
- errorbar,erint or list of float or Errorbar object
[color,size,linewidth,riserlinewidth] as [1,1,1,1]; no increment, no repeat
color int see symbol color, non-integer syncs to symbol color
size float default 1.0 ; smaller is 0.5
linewidth float default 1.0
riserlinewidth float default 1.0
- legend,lestring
determines legend for all datasets
string replacement: attr name prepended by ‘$’ (eg. ‘$par’) is replaced by value str(par1.flatten()[0]) if possible. $(par) for not unique names
- comment: string
string determines comment for all datasets
for dataArray: list of attribute values is set as comment to ckeck use dataArray.resumeAttrTxt()
- autoscalebool
default True, False
- internal_autoscalebool
default True, False 10% border
- redrawbool
redraw
Notes
Plot types determined by dimension of dataset
- 1: dataset is type Data instances
See Data class for possibilities and original documentation.
- 2: dataset is numpy array; simplified version
Use slices like data_in_numpyarray[[0,3,2],:] to select columns to plot
len(array)= 2 XY
len(array)= 3 XYDY
len(array)= 4 XYDXDY
- 3: dataset is dataArray ; simplified version
attributes X,Y,eY,eX determine plot type if they exist. So set these before plot by dataset.setColumnIndex(3,4,7)
default is 0,1,2 for X,Y,eY, No eX
Slicing works too as for arrays.
For more complex plots use original Data class in 1. Old style plotting needs creation of GracePlot.Data objects like
d1=Data(x=x,y=y,symbol=GracePlot.Symbol(symbol=circle,fillcolor=red),line=GracePlot.Line(type=none))
or in short abreviation:
d1=Data(x=x,y=y,symbol=[-1,2,3,4],line=[1,2,3])
#plotted sets can be accessed by
p[0].datasets   as a list of Data objects
Examples
tX =np.r_[0:10]
tY=np.sin(tX)
data=np.c_[tX,tY,tY*0.05].T
p=s.grace()                    # open plot
# plot single column data tX,tY,teY
p.plot(tX,tY,legend='all 1D data',symbol=3,line=1,errorbar=[0])
#plot Data with arrray or dataList
p.plot(data,legend='description',symbol=[1,0.5,4],line=[1,2,2],errorbar=[0])
p.yaxis(label='whatever / m')  # change y label
p.legend()                     # show legends
- Title(title=None, font=None, size=None, color=None)
Sets the graph title.
- Parameters:
- titlestring
Title string
- font
Font of title
- sizefloat
Size of title
- colorinteger
Color of title
- Subtitle(subtitle=None, font=None, size=None, color=None)
Sets the graph subtitle
see title
- Yaxis(min=None, max=None, **kwargs)
Format of axis
- Parameters:
- axis_prefix{‘x’,’y’}
determines axis
- ax_min,ax_maxfloat
min and max of axis
- scale{‘normal’, ‘logarithmic’, or ‘reciprocal’ or respectivly ‘n’,’l’,’r’}
sets type of axis
- labelstring, list or Label object
Label of the axis; see Label object.
string: this is the label string.
list = [label string, charsize, place, color, location]
place : ‘normal’,’both’,’opposite’
location : [parallel, perpendicular] offset from axis center. defauls [0,0.08]
- invert{True,False}
invert axis
- formulagrace equation
formula for ticklabel calculation eg. for rescaling.
$t is label -> scaling as “$t*1e5”
- charsize,sizefloat
determines character size, default 1
- offsetlist of float
determines the position of the normal and opposite axis position
- autotickbool
autoticking
- tickTick object or list, False, True
list of [major tick distance , minorticks number, majorsize, minorsize, position]
position as one of ‘normal’,’both’,’opposite’ (first letter is enough)
False, True switch Ticks on and off
see Tick for more
- ticklabelfloat, list, tickLabel object
With [format,precision,charsize,placeon] or a shortcut
format: ‘decimal’,’exponential’,’general’,’power’,’scientific’
precision : integer
charsize : float
placeon : ‘normal’,’both’,’opposite’
Shortcuts:
‘on’, ‘off’,1,0: switch ticklabel on/off
float: used as charsize
one of format strings: change format (‘power’,’scientific’ with precision=0’)
- bar‘on’,’off’,list or bar object
list=[onoff,color,linestyle,linewidth]
See bar object. ‘on’/’off’ switch on or off.
- Xaxis(min=None, max=None, **kwargs)
Format of axis
- Parameters:
- axis_prefix{‘x’,’y’}
determines axis
- ax_min,ax_maxfloat
min and max of axis
- scale{‘normal’, ‘logarithmic’, or ‘reciprocal’ or respectivly ‘n’,’l’,’r’}
sets type of axis
- labelstring, list or Label object
Label of the axis; see Label object.
string: this is the label string.
list = [label string, charsize, place, color, location]
place : ‘normal’,’both’,’opposite’
location : [parallel, perpendicular] offset from axis center. defauls [0,0.08]
- invert{True,False}
invert axis
- formulagrace equation
formula for ticklabel calculation eg. for rescaling.
$t is label -> scaling as “$t*1e5”
- charsize,sizefloat
determines character size, default 1
- offsetlist of float
determines the position of the normal and opposite axis position
- autotickbool
autoticking
- tickTick object or list, False, True
list of [major tick distance , minorticks number, majorsize, minorsize, position]
position as one of ‘normal’,’both’,’opposite’ (first letter is enough)
False, True switch Ticks on and off
see Tick for more
- ticklabelfloat, list, tickLabel object
With [format,precision,charsize,placeon] or a shortcut
format: ‘decimal’,’exponential’,’general’,’power’,’scientific’
precision : integer
charsize : float
placeon : ‘normal’,’both’,’opposite’
Shortcuts:
‘on’, ‘off’,1,0: switch ticklabel on/off
float: used as charsize
one of format strings: change format (‘power’,’scientific’ with precision=0’)
- bar‘on’,’off’,list or bar object
list=[onoff,color,linestyle,linewidth]
See bar object. ‘on’/’off’ switch on or off.
- Clear(slice=slice(None, None, None), hold=0)
Clear plot
- Parameters:
- sliceslice
Selects elements to delete. If ommited clear all. e.g. last for elements slice=slice(-4) don’t use slice extensivly as it could mess up.
- holdbool, default 0
Set/reset to hold lines.
- Legend(strings=None, x=None, y=None, boxcolor=None, boxpattern=None, boxlinewidth=None, boxlinestyle=None, boxfillcolor=None, boxfillpattern=None, font=None, charsize=None, color=None, length=None, vgap=None, hgap=None, invert=None, world_coords=True, offset=0, onoff=True, position=None)
Place the legend in the plot or update it.
- Parameters:
- stringslist of strings,string, default=None
List of legend strings or one string. If None then self.legend_strings is used. self.legend_strings is build from legend attribute in plot
- offsetint, default 0
Which legend string to change if strings is single string >0 with offset shifted =<0 starting from last reverse order default 0 names last legend
- x,y: float
Position of the upper left corner of the box in data coordinates
- boxcolorint
Color of the legend box lines
- boxpatterninteger
Pattern of the legend box lines
- boxlinewidthfloat
Thickness of the line
- boxlinestyle,boxfillcolor,boxfillpatterninteger
As name says
- fontint
Is the font used in the legend
- charsizefloat
Size of the characters
- lengthint
Length of the box must be an integer
- vgapint
Vertical space between entries, can be a float
- hgapfloat
Horizontal spacing in the box can be a float
- invertbool, (True,False)
Order of entries, either in the order they are entered, or the opposite
- onoffbool
Show legend or not
- position‘ll’, ‘ur’, ‘ul’, ‘lr’
Legend position shortcut. Shortcuts for lower left, upper right, upper left, lower right.
- Autoscale(axis=None)
autoscales axes
- axis‘x’,’y’,None
None, scale all axes, otherwise if it is ‘x’ or ‘y’ scale that axis
- class jscatter.graceplot.GracePlot(width=None, height=None, auto_redraw=True, redraw_interval=0.1, headless=False, size=None)[source]
Bases:
objectOpen a Figure that will contain several graceGraph.
Default resolution is 300 dpi
- Parameters:
- widthfloat
Page width in inch, pixel width = width*resolution = width*300
- heightfloat
Page height in inch, pixel height = height*resolution = height*300
- auto_redrawbool
Redraw
- redraw_intervalfloat
Time between redraw.
- headlessbool
Use plot in nonGui mode (headless). Save Plot using save method and inspect later.
- Returns:
- GracePlotGracePlot instance
Notes
default resolution is 300 dpi
Create a GracePlot object, which manages an external grace instance. The instance may have multiple GraceGraph objects within it. Commands which are specific to a graph (such as plotting data) are sent to the graph object. Commanbds which are global (such as redraw control) are sent to the GracePlot object.
width*resolution=width in pixels, same for height. Resolution is set to 300 by default, so width is roughly inches on an 300 dpi monitor. By changing the class default resolution, you can change the units of width & height.
If auto_redraw is True, the graph will automatically hold off redrawing until data stops being sent for a time of redraw_interval (seconds).
To force an immediate redraw, call GracePlot.redraw(force=True). Calling GracePlot.redraw() without an argument schedules a redraw at the next quiet interval. This mechanism greatly reduces thrashing of grace windows by repeated un-needed redraws.
To force a redraw on the next cycle of the redrawing thread, call GracePlot.redraw(soon=True). This will cause a redraw even if there is still data flowing, but not in a hurry.
The GracePlot class does all its data transmission through a thread, so usually there should be no significant time during which the calling thread is blocked. This should improve real-time performance.
- resolution = 300
resolution of the plot
- command_args = ('-nosafe', '-noask')
- headless = False
- grace_command = b''
- close()[source]
Closes the plot
- is_open()[source]
Return True if the pipe is not known to have been closed.
- focus(graph_index=None, grace_graph=None)[source]
Direct commands sent to the GracePlot to the appropriate GraceGraph.
Mostly for backwards compatibility. It is preferable to send the commands directly to the plot:
p[2].plot(....)
- new_graph(**kwargs)[source]
Add a new graph to plot.
- Parameters:
- xmin,xmax,ymin,ymaxfloat; default 0.15,0.95,0.15,0.88
Position of edges in plot in relative view coordinates
- plot(*args, **kwargs)[source]
Shortcut for sending the command directly to the appropriate graceGraph object see below
Plot data in xmgrace
e.g. p.plot(data,legend=’description’,symbol=[1,0.5,4],line=[1,2,2],errorbar=[0])
- Parameters:
- datasetsdataArray, dataList,numpy array, lists of them
Several of (comma separated) nonkeyword arguments or as list. If dimension of datasets is one a new Data object is created and plotted see Notes below for error plots.
- symbol,syint, list of float or Symbol object
[symbol,size,color,fillcolor,fillpattern,linewidth] as [1,1,1,-1,2];
single integer to chose symbol e.g.symbol=3; symbol=0 switches off
negative increments from last, non integer repeat last
symbol => 0-11 = ◦,☐,♢,▵,◁,▽,▷,+,×,☆,(11 is char)
size => size, a number e.g.0.5
color => int 0-16 = white,black,red,green,blue,ligth green,brown, darkgrey,violet,orange,magenta,grey
fillcolor=None : set color and adds fillpattern=1, non-integer syncs to symbol color
fillpattern=None 0 empty, 1 full, ….test it
linewidth 0.1-10 width of line for open symbols.
- line,liint, list of float or Line object
[linestyle,linewidth,color] as [1,1,’’];
negative increments;non integer as ‘’ repeats last
single integer to chose line line=1; line=0 switches of
linestyle int 1 normal, 2 dotted, 3 dashed, 4 long dashed, 5 dot-dashed
linewidth float goes from 0 to 6 in increasing thickness
color see symbol color, non-integer syncs to symbol color
- errorbar,erint or list of float or Errorbar object
[color,size,linewidth,riserlinewidth] as [1,1,1,1]; no increment, no repeat
color int see symbol color, non-integer syncs to symbol color
size float default 1.0 ; smaller is 0.5
linewidth float default 1.0
riserlinewidth float default 1.0
- legend,lestring
determines legend for all datasets
string replacement: attr name prepended by ‘$’ (eg. ‘$par’) is replaced by value str(par1.flatten()[0]) if possible. $(par) for not unique names
- comment: string
string determines comment for all datasets
for dataArray: list of attribute values is set as comment to ckeck use dataArray.resumeAttrTxt()
- autoscalebool
default True, False
- internal_autoscalebool
default True, False 10% border
- redrawbool
redraw
Notes
Plot types determined by dimension of dataset
- 1: dataset is type Data instances
See Data class for possibilities and original documentation.
- 2: dataset is numpy array; simplified version
Use slices like data_in_numpyarray[[0,3,2],:] to select columns to plot
len(array)= 2 XY
len(array)= 3 XYDY
len(array)= 4 XYDXDY
- 3: dataset is dataArray ; simplified version
attributes X,Y,eY,eX determine plot type if they exist. So set these before plot by dataset.setColumnIndex(3,4,7)
default is 0,1,2 for X,Y,eY, No eX
Slicing works too as for arrays.
For more complex plots use original Data class in 1. Old style plotting needs creation of GracePlot.Data objects like
d1=Data(x=x,y=y,symbol=GracePlot.Symbol(symbol=circle,fillcolor=red),line=GracePlot.Line(type=none))
or in short abreviation:
d1=Data(x=x,y=y,symbol=[-1,2,3,4],line=[1,2,3])
#plotted sets can be accessed by
p[0].datasets   as a list of Data objects
Examples
tX =np.r_[0:10]
tY=np.sin(tX)
data=np.c_[tX,tY,tY*0.05].T
p=s.grace()                    # open plot
# plot single column data tX,tY,teY
p.plot(tX,tY,legend='all 1D data',symbol=3,line=1,errorbar=[0])
#plot Data with arrray or dataList
p.plot(data,legend='description',symbol=[1,0.5,4],line=[1,2,2],errorbar=[0])
p.yaxis(label='whatever / m')  # change y label
p.legend()                     # show legends
- SetView(*args, **kwargs)[source]
Shortcut for sending the command directly to the appropriate graceGraph object see below
this sets the viewport coords so they are available later for translating string and line coords.
- Parameters:
- xmin,xmax,ymin,ymaxfloat
view range
- aspect_scaledbool
aspect
- shiftbyfactor(*args, **kwargs)[source]
Shortcut for sending the command directly to the appropriate graceGraph object see below
Shift data consecutively by factors
Consecutively multiply by 2 as 2,4,6,8…. or with power laws.
- Parameters:
- xy‘xy’
Selector for x or y axis or both
- factorfloat
Shift factor
- repeatfloat default=number of sets in plot
Repeat number of times the factor 3 -> 2,4,6,2,4,6… for factor=2
- xfactorsarray or list
Factors as list, overrides factor and repeat
- yfactorsarray or list
Factors as list,overrides factor and repeat dylist is also shifted
- scale‘log’, other
If ‘log’ a factor**i is used for logarithmic scale all other factor*i is used
Notes
List is
factor*np.tile(np.r_[1:repeat+1],nSets)  lin scale
factor**np.tile(np.r_[1:repeat+1],nSets)  log scale
Create factors manually e.g. by
np.tile([1,2,3],3)         -->  array([1, 2, 3, 1, 2, 3, 1, 2, 3])
1.1**np.tile([1,1,2],3)    -->  array([1.1, 1.1, 1.21, 1.1, 1.1, 1.21, 1.1, 1.1, 1.21])
#for an inverse shifting
2*np.tile(np.r_[10:1:-1],3)-->  array([20, 18, 16, 14, 12, 10,  8,  6,  4, 20, 18, 16, 14, 12, 10,  8,  6, 4])
- legend(*args, **kwargs)[source]
Shortcut for sending the command to current graceGraph
Place the legend in the plot or update it.
- Parameters:
- stringslist of strings,string, default=None
List of legend strings or one string. If None then self.legend_strings is used. self.legend_strings is build from legend attribute in plot
- offsetint, default 0
Which legend string to change if strings is single string >0 with offset shifted =<0 starting from last reverse order default 0 names last legend
- x,y: float
Position of the upper left corner of the box in data coordinates
- boxcolorint
Color of the legend box lines
- boxpatterninteger
Pattern of the legend box lines
- boxlinewidthfloat
Thickness of the line
- boxlinestyle,boxfillcolor,boxfillpatterninteger
As name says
- fontint
Is the font used in the legend
- charsizefloat
Size of the characters
- lengthint
Length of the box must be an integer
- vgapint
Vertical space between entries, can be a float
- hgapfloat
Horizontal spacing in the box can be a float
- invertbool, (True,False)
Order of entries, either in the order they are entered, or the opposite
- onoffbool
Show legend or not
- position‘ll’, ‘ur’, ‘ul’, ‘lr’
Legend position shortcut. Shortcuts for lower left, upper right, upper left, lower right.
- clear(*args, **kwargs)[source]
Shortcut for sending the command to current graceGraph see below
Clear plot
- Parameters:
- sliceslice
Selects elements to delete. If ommited clear all. e.g. last for elements slice=slice(-4) don’t use slice extensivly as it could mess up.
- holdbool, default 0
Set/reset to hold lines.
- hold(*args, **kwargs)[source]
Shortcut for sending the command to current graceGraph see below
Turn on/off overplotting for this graph.
Call as hold() to toggle, hold(1) to turn on, or hold(0) to turn off. Returns the previous hold setting.
- title(*args, **kwargs)[source]
Shortcut for sending the command to current graceGraph see below
Sets the graph title.
- Parameters:
- titlestring
Title string
- font
Font of title
- sizefloat
Size of title
- colorinteger
Color of title
- subtitle(*args, **kwargs)[source]
Shortcut for sending the command to current graceGraph see below
Sets the graph subtitle
see title
- xaxis(*args, **kwargs)[source]
Shortcut for sending the command to current graceGraph
Format of axis
- Parameters:
- axis_prefix{‘x’,’y’}
determines axis
- ax_min,ax_maxfloat
min and max of axis
- scale{‘normal’, ‘logarithmic’, or ‘reciprocal’ or respectivly ‘n’,’l’,’r’}
sets type of axis
- labelstring, list or Label object
Label of the axis; see Label object.
string: this is the label string.
list = [label string, charsize, place, color, location]
place : ‘normal’,’both’,’opposite’
location : [parallel, perpendicular] offset from axis center. defauls [0,0.08]
- invert{True,False}
invert axis
- formulagrace equation
formula for ticklabel calculation eg. for rescaling.
$t is label -> scaling as “$t*1e5”
- charsize,sizefloat
determines character size, default 1
- offsetlist of float
determines the position of the normal and opposite axis position
- autotickbool
autoticking
- tickTick object or list, False, True
list of [major tick distance , minorticks number, majorsize, minorsize, position]
position as one of ‘normal’,’both’,’opposite’ (first letter is enough)
False, True switch Ticks on and off
see Tick for more
- ticklabelfloat, list, tickLabel object
With [format,precision,charsize,placeon] or a shortcut
format: ‘decimal’,’exponential’,’general’,’power’,’scientific’
precision : integer
charsize : float
placeon : ‘normal’,’both’,’opposite’
Shortcuts:
‘on’, ‘off’,1,0: switch ticklabel on/off
float: used as charsize
one of format strings: change format (‘power’,’scientific’ with precision=0’)
- bar‘on’,’off’,list or bar object
list=[onoff,color,linestyle,linewidth]
See bar object. ‘on’/’off’ switch on or off.
- yaxis(*args, **kwargs)[source]
Shortcut for sending the command to current graceGraph
Format of axis
- Parameters:
- axis_prefix{‘x’,’y’}
determines axis
- ax_min,ax_maxfloat
min and max of axis
- scale{‘normal’, ‘logarithmic’, or ‘reciprocal’ or respectivly ‘n’,’l’,’r’}
sets type of axis
- labelstring, list or Label object
Label of the axis; see Label object.
string: this is the label string.
list = [label string, charsize, place, color, location]
place : ‘normal’,’both’,’opposite’
location : [parallel, perpendicular] offset from axis center. defauls [0,0.08]
- invert{True,False}
invert axis
- formulagrace equation
formula for ticklabel calculation eg. for rescaling.
$t is label -> scaling as “$t*1e5”
- charsize,sizefloat
determines character size, default 1
- offsetlist of float
determines the position of the normal and opposite axis position
- autotickbool
autoticking
- tickTick object or list, False, True
list of [major tick distance , minorticks number, majorsize, minorsize, position]
position as one of ‘normal’,’both’,’opposite’ (first letter is enough)
False, True switch Ticks on and off
see Tick for more
- ticklabelfloat, list, tickLabel object
With [format,precision,charsize,placeon] or a shortcut
format: ‘decimal’,’exponential’,’general’,’power’,’scientific’
precision : integer
charsize : float
placeon : ‘normal’,’both’,’opposite’
Shortcuts:
‘on’, ‘off’,1,0: switch ticklabel on/off
float: used as charsize
one of format strings: change format (‘power’,’scientific’ with precision=0’)
- bar‘on’,’off’,list or bar object
list=[onoff,color,linestyle,linewidth]
See bar object. ‘on’/’off’ switch on or off.
- xlabel(*args, **kwargs)[source]
- Shortcut for sending the command to current graceGraph
see below
- Convenience function to set the xaxis label
charsize detemines charsize, default 1
- ylabel(*args, **kwargs)[source]
- Shortcut for sending the command to current graceGraph
see below
Convenience function to set the yaxis label
- xlimit(*args, **kwargs)[source]
- Shortcut for sending the command to current graceGraph
see below
Convenience function to set the lower and/or upper bounds of the x-axis.
- ylimit(*args, **kwargs)[source]
- Shortcut for sending the command to current graceGraph
see below
Convenience function to set the lower and/or upper bounds of the y-axis.
- resetlast()[source]
Resets last used symbols and lines.
lastline=[1,0,0] lastsymbol=[1,0.5,1,0] lasterror=[0,0,0,0]
- text(*args, **kwargs)[source]
Writes text to graph at specified position.
- Parameters:
- stringstring
Text to print
- x,y: float
Coordinates are the cartesian coordinates of x,y axis
- colorint
Color
- rotfloat
Rotation angle
- fontint
Font as defined in default xmgrace plot
- just
Justification
- charsizefloat
Charsize
- world_coordsbool
World coordinates or viewport coordinates
Notes
Try in Gui for values.
- write(command)[source]
Make a graceSession look like a file, and flush after send
- multi(rows, cols, offset=0.13, hgap=0.1, vgap=0.15)[source]
Create a grid of graphs with the given number of <rows> and <cols>
Arrange existing graphs (or add extra if needed) to form an nrows by ncols matrix, leaving offset at each page edge with hgap and vgap relative horizontal and vertical spacings
- Parameters:
- rows,colsinteger
Number of graphs
- offsetfloat
Offset from edges
- hgap,vgapfloat
Horizontal, vertical gap between plots
Notes
Overmuch graphs are deleted
- stacked(number, hshift, vshift, frame=None, yaxis='off', yaxisnumber=0, frametype=0, framepattern=1)[source]
Creates a stacked chart with shifted graphs in the frame
Already exsiting graphs are reused, fineadjustement needs to be done by hand.
- Parameters:
- numberint
Number of graphs
- hshiftfloat
Horizontal shift in viewport coords
- vshiftfloat
Vertikal shift in viewport coords
- yaxis‘normal’,’opposite’,’both’,default ‘off’
Where to place the yaxis
- framepatternint
Frame pattern type; 1 is No frame
- frame[float,float,float,float], default [0.15,0.15,0.9,0.9]
Frame size in viewport coordinates [0..1]
- yaxisnumberint
Framenumber where to place yaxis
- frametypeint
Frametype 0=closed,1=halfopen,2,3,4,5= break at top,bottom,left,right
- framepattern
0= None, 1=full,…..and so on
Examples
p.stacked(10,hshift=0.02,vshift=0.01,yaxis='off')
p.stacked(10,hshift=-0.015,vshift=-0.01,yaxis='off')
#create a stacked chart of 10 plots
# each shifted by hshift,vshift
#the yaxis is switched off for all except the first
x=np.r_[0:5:100j]
p=js.grace()
p.stacked(10,hshift=0.02,vshift=0.01,yaxis='off')
#plot some Gaussians
for i in np.arange(10):p[i].plot(x,(i+1)*np.exp(-((x-2)*3)**2),li=[1,2,i+1],sy=0)
#choose the same yscale for the data but no ticks for the later plots
p.g[0].yaxis(min=0,max=10)
for pp in p.g[1:]:pp.yaxis(min=0,max=10,tick=False)
#adjusting the scale and the size of the xaxis ticks
for pp in p:pp.xaxis(tick=[1,1,0.3,0.1])
p[0].yaxis(tick=[1,1,0.3,0.1])
- updateall()[source]
Update the GUI (graph and set selectors etc) to reflect the current project state
- send_commands(*commands)[source]
Send a list of commands, and then flush
- Parameters:
- commandslist of strings
- exit()[source]
Nuke the grace session.
- redraw(force=False, soon=False)[source]
Refresh the plot
- save(filename, size=(3.4, 2.4), dpi=300, format=None)[source]
Save the current plot.
- Parameters:
- filenamestring
If filename has extension this is used instead of format.
- size(float, float)
Size in inch. For PRL and other papers: Figures should be planned for the column width (8.4 cm or 3 3/8 = 3.4 in.) with 600 dpi:
150 dpi (ok in Powerpoint as png )
300 dpi (default) for fast printing
600 dpi (paper ready quality e.g. as eps, jpg or png)
svg or pdf are vector graphics and scale their resolution.
- dpiin
- Resolution in dots per inch (2.54 cm)
format : string x11, postscript, eps, pdf, mif, svg, pnm, jpeg, png, metafile
- formatDefault is Grace ‘.agr’ file
‘agr’, ‘eps’, ‘jpeg’, ‘metafile’, ‘mif’, ‘pdf’, ‘png’, ‘pnm’, ‘postscript’, ‘svg’, ‘x11’
Notes
Not all drivers are created equal. For caveats that apply to some of these formats see the Grace documentation.
- resize(xdim, ydim)[source]
Change the page dimensions (in pixel)for plots with fixed size.
- Parameters:
- xdim, ydimint
dimension in pixel
- assign_color(idx, rgb, name)[source]
Assign color to an index including new colors.
- Parameters:
- idxint (0..16..)
Index of color.
- rgbset of integer (0..255)
RGB color as (0,0,0)
- namestring
New name of color.
Notes
If used indices are changed the corresponding elements using this are changed too. This means changing index 1 (usually black) used for the axes changes axes color.
More can be used.
Examples
Set color 4 to (0, 0, 255) as blue
assign_color(4, (0,0,255), 'blue')
Append a list of new colors and use them in plot
x=np.r_[1:10]
p=js.grace()
p.colors.list    # shows actual color list
NN=40
clist=np.c_[np.r_[1:NN+1],np.r_[255:0:NN*1j].round(),np.r_[255:0:NN*1j].round(),np.r_[0:255:NN*1j].round()]
for i,r,g,b in clist:
   p.assign_color(i+15,(r,g,b),'test%.2g' %i)
for i in np.r_[1:p.colors.len]:
   p.plot(x,x+i,sy=[1,0.7,p.colors.len-i],li=[1,5,i])
reassign colors
clist=np.c_[np.r_[1:NN+1],np.r_[0:255:NN*1j].round(),np.r_[255:0:NN*1j].round(),np.r_[0:255:NN*1j].round()]
for i,r,g,b in clist:
   p.assign_color(i+15,(r,g,b),'test%.2g' %i)
reassign colors grey scale:
clist=np.c_[np.r_[1:NN+1],np.r_[0:255:NN*1j].round(),np.r_[0:255:NN*1j].round(),np.r_[0:255:NN*1j].round()]
for i,r,g,b in clist:
   p.assign_color(i+15,(r,g,b),'test%.2g' %i)
- aspect_scale(x, y)[source]
scale view coordinates to that (1,1) fills view, roughly
- Clear(*args, **kwargs)
Shortcut for sending the command to current graceGraph see below
Clear plot
- Parameters:
- sliceslice
Selects elements to delete. If ommited clear all. e.g. last for elements slice=slice(-4) don’t use slice extensivly as it could mess up.
- holdbool, default 0
Set/reset to hold lines.
- Exit()
Nuke the grace session.
- Save(filename, size=(3.4, 2.4), dpi=300, format=None)
Save the current plot.
- Parameters:
- filenamestring
If filename has extension this is used instead of format.
- size(float, float)
Size in inch. For PRL and other papers: Figures should be planned for the column width (8.4 cm or 3 3/8 = 3.4 in.) with 600 dpi:
150 dpi (ok in Powerpoint as png )
300 dpi (default) for fast printing
600 dpi (paper ready quality e.g. as eps, jpg or png)
svg or pdf are vector graphics and scale their resolution.
- dpiin
- Resolution in dots per inch (2.54 cm)
format : string x11, postscript, eps, pdf, mif, svg, pnm, jpeg, png, metafile
- formatDefault is Grace ‘.agr’ file
‘agr’, ‘eps’, ‘jpeg’, ‘metafile’, ‘mif’, ‘pdf’, ‘png’, ‘pnm’, ‘postscript’, ‘svg’, ‘x11’
Notes
Not all drivers are created equal. For caveats that apply to some of these formats see the Grace documentation.
- Multi(rows, cols, offset=0.13, hgap=0.1, vgap=0.15)
Create a grid of graphs with the given number of <rows> and <cols>
Arrange existing graphs (or add extra if needed) to form an nrows by ncols matrix, leaving offset at each page edge with hgap and vgap relative horizontal and vertical spacings
- Parameters:
- rows,colsinteger
Number of graphs
- offsetfloat
Offset from edges
- hgap,vgapfloat
Horizontal, vertical gap between plots
Notes
Overmuch graphs are deleted
- class jscatter.graceplot.Data(x=None, y=None, symbol=None, line=None, legend='', comment=None, errorbar=None, pairs=None, dylist=None, **kwargs)[source]
Bases:
objectSimplest base class for all GracePlot data objects.
- dataset_type_name = 'xy'
- x_format_string = '%s'
- y_format_string = '%s'
- output(graceGraph, count)[source]
No checking is done to make sure the datasets are consistent with each other, same number of x and y etc… Support of None values is only in the xy graph.
- output_differences(graceGraph, count, new_x, new_y, new_dylist)[source]
output strings to modify already created datasets, issuing results only for changed items
- class jscatter.graceplot.DataXYDY(x, y, dy, **kwargs)[source]
Bases:
DataA data set with symmetrical error bars in the ‘y’ direction
- dataset_type_name = 'xydy'
- class jscatter.graceplot.DataXYDX(x, y, dx, **kwargs)[source]
Bases:
DataA data set with symmetrical error bars in the ‘x’ direction
- dataset_type_name = 'xydx'
- class jscatter.graceplot.DataXYDYDY(x, y, dy_down, dy_up, **kwargs)[source]
Bases:
DataA data set with asymmetrical error bars in the ‘y’ direction
- dataset_type_name = 'xydydy'
- class jscatter.graceplot.DataXYDXDX(x, y, dx_left, dx_right, **kwargs)[source]
Bases:
DataA data set with asymmetrical error bars in the ‘x’ direction
- dataset_type_name = 'xydxdx'
- class jscatter.graceplot.DataXYDXDY(x, y, dx, dy, **kwargs)[source]
Bases:
DataA data set with symmetrical error bars in the ‘x’ and ‘y’ direction
- dataset_type_name = 'xydxdy'
- class jscatter.graceplot.DataXYDXDXDYDY(x, y, dx_left, dx_right, dy_down, dy_up, **kwargs)[source]
Bases:
DataA data set with asymmetrical error bars in the ‘x’ and ‘y’ direction
- dataset_type_name = 'xydxdxdydy'
- class jscatter.graceplot.DataXYBoxWhisker(x, y, whisker_down, box_down, whisker_up, box_up, **kwargs)[source]
Bases:
DataA data set with a box for an asymmetrical inner error in the ‘y’ direction and an error bar (whisker) for the asymmetrical outer error bound. The symbol properties set the color (etc.) of the box. The errorbar properties set the color (etc.) of the whisker
- dataset_type_name = 'xyboxplot'
- class jscatter.graceplot.DataBar(x=None, y=None, symbol=None, line=None, legend='', comment=None, errorbar=None, pairs=None, dylist=None, **kwargs)[source]
Bases:
Data- dataset_type_name = 'bar'
- class jscatter.graceplot.Symbol(type=None, symbol=None, size=None, color=1, pattern=None, linewidth=None, linestyle=None, filltype=None, fillrule=None, fillcolor=None, fillpattern=None, char=None, charfont=None, skip=None, annotation=None, errorbar=None)[source]
Bases:
objectSymbol object
- Parameters:
- typeNone,’xy’,’xydy’,’xydxdy’,….,’bar’ ==> 0, 1, 2, 3, ….. 0
None is automatic determination inside grace
- symbol(0..11)
0 None, 1 circle, 2 square, 3 diamond, 4 triangle up, 5 triangle left, 6 triangle down, 7 triangle right, 8 +, 9 x, 10 *, 11 character,
- sizefloat
Self explanatory, 0.5 is 50 in the GUI
- patternint 0-24
The pattern of the outline of the symbol, usually it will be 1
- linewidthfloat
thickness of the outline of the symbol
- linestyleint
0 None, 1 solid, 2 points, 3 broken line
- fillcolorint
color the symbol is filled with, by default it is the same as the outline color.
- fillpatternint, 0..24
pattern of the fill, 1 is solid, 0 is None, there are about 24 choices as dotted, dashed, squared.
- output(dataset)[source]
list output to sent to grace
- class jscatter.graceplot.Line(type=None, linestyle=None, linewidth=None, color=None, pattern=None, baselinetype=None, baseline=None, dropline=None)[source]
Bases:
objectLine objekt
- Parameters:
- type: int
0 None; 1 straigth; 2 left_stairs; 3 right_stairs; 4 Segments; 5 3-Segments
- linestyleint
1 is normal; 2 is dotted; 3 is dashed; 4 is long dashed; 5 is dot-dashed
- linewidthfloat
goes from 0 to 6 in increasing thickness
- colorint
color
- patternint
fill pattern 1 is solid, 0 is None, there are about 24 choices as dotted, dashed, squared.
- baselineint
show baseline
- baselinetypeint
0 Zero; 1 set min: 2 set max; 3 graph min: 4 graph max; 5 set average
- dropline0,1
drop line to baseline
- output(dataset)[source]
list output to sent to grace
- class jscatter.graceplot.Label(string=None, layout=None, place=None, charsize=None, font=None, color=None, axis=None, location=None)[source]
Bases:
objectUsed for labels of the x-axis and y-axis
- output(axis)[source]
list output to sent to grace
- class jscatter.graceplot.Bar(axis=None, onoff=True, color=None, linestyle=None, linewidth=None)[source]
Bases:
objectthis class controls the x and y bars in the frame apparently usually it is off onoff is ‘on’ or ‘off’ the rest are like everything else
- output(axis)[source]
list output to sent to grace
- class jscatter.graceplot.Tick(axis=None, onoff=True, major=None, minorticks=None, inout=None, majorsize=None, majorcolor=None, majorlinewidth=None, majorlinestyle=None, majorgrid=None, minorcolor=None, minorlinewidth=None, minorlinestyle=None, minorgrid=None, minorsize=None, placeon=None, type=None, default=None, TickLabel=None)[source]
Bases:
objectControls appearence of ticks on an axis.
- Parameters:
- onoff
is either ‘on’ or ‘off’
- major
is the space between ticks?
- minorticks
is the number of minorticks between major ticks?
- inout
determines if they point ‘in’ or ‘out’ or ‘both’
- majorsize
determines how long the major ticks are
- majorlinewidth
is how thick the major ticks are
- majorlinestyle
is controls the linestle of the ticks and major gridlines
- majorgrid
turns the major grid lines ‘on’ or ‘off’
- minorcolor
is the color of the minor tick lines
- minorlinewidth
- minorlinestyle
controls the linestle of the ticks and minor gridlines
- minorgrid
turns the minor gridlines on
- minorsize
is the lengthe of the minor gridlines
- placeon
is it is usually set to ‘both’,’normal’,’opposite’
- type
is ? it is usually set to ‘auto’
- default
is ? a number
- output(axis)[source]
list output to sent to grace
- class jscatter.graceplot.TickLabel(axis=None, onoff=True, type=None, prec=None, format=None, append=None, prepend=None, angle=None, placeon=None, skip=None, stagger=None, op=None, sign=None, starttype=None, start=None, stoptype=None, stop=None, charsize=None, font=None, color=None)[source]
Bases:
objectTicklabels
- Parameters:
- onoff‘on’,’off’
- type ‘auto’
- prec
- format :string ,’general’ is default
decimal,exponential,general,power,scientific
- appendstring
added to the end of the label
- prependstring
added to the beginning of the label
- anglefloat
degrees? of rotation
- placeon‘normal’,’both’,’opposite’
where to place labels
- skipint which skips some labels somehow
- staggeris an integer that staggers the labels somehow
- op‘bottom’ for x-axis, ‘left’ for y-axis
- sign‘normal’
- starttypestring ‘auto’
- startfloat don;t know what it does
- stoptypestring ‘auto’
- stopfloat purpose?
- charsizefloat for character size
- fontinteger for the font
- colorinteger for the color
- Returns:
- TickLabel object
- output(axis)[source]
list output to sent to grace
- class jscatter.graceplot.Annotation(onoff=True, type=None, charsize=None, font=None, color=None, rot=None, format=None, prec=None, prepend=None, append=None, offset=None)[source]
Bases:
objectcontrols annotation
- Parameters:
- onoff‘on’ or ‘off’
- typeint
- charsizefloat
- fontint
- colorint
- rotfloat
- formatint
- precint
- prependint
- appendint
- offsetint
- output(dataset)[source]
list output to sent to grace
- class jscatter.graceplot.Errorbar(onoff=True, place=None, color=None, pattern=None, size=None, linewidth=None, linestyle=None, riserlinewidth=None, riserlinestyle=None, riserclip=None, risercliplength=None)[source]
Bases:
objectclass for errorbars
- Parameters:
- onoffTrue False,’on’,’off’, default on
turns the error bars on or off
- place‘normal’, ‘opposite’, ‘both’ default ‘both’
- colorint
color integer
- patternint
- linewidthfloat
- linestyleint
- riserlinewidthfloat
risers are the lines from the symbol to the end
- riserlinestyleint
- riserclip‘on’,’off’
set to on or off, determines if an arrow is drawn for error bars offscale
- risercliplengthfloat
- output(symbol)[source]
list output to sent to grace
- jscatter.graceplot.test()[source]
11.1.1. GracePlot
|
Open a Figure that will contain several graceGraph. |
|
Shortcut for sending the command directly to the appropriate graceGraph object see below |
|
Create a grid of graphs with the given number of <rows> and <cols> |
|
Add a new graph to plot. |
|
Creates a stacked chart with shifted graphs in the frame |
|
Shortcut for sending the command to current graceGraph see below |
Nuke the grace session. |
|
|
Shortcut for sending the command to current graceGraph |
|
Save the current plot. |
|
Shortcut for sending the command to current graceGraph see below |
|
Writes text to graph at specified position. |
|
Shortcut for sending the command to current graceGraph see below |
Update the GUI (graph and set selectors etc) to reflect the current project state |
|
|
Make a graceSession look like a file, and flush after send |
|
Shortcut for sending the command to current graceGraph |
|
Shortcut for sending the command to current graceGraph |
|
Shortcut for sending the command to current graceGraph |
|
Shortcut for sending the command to current graceGraph |
|
Shortcut for sending the command to current graceGraph |
|
Shortcut for sending the command to current graceGraph |
|
scale view coordinates to that (1,1) fills view, roughly |
|
Assign color to an index including new colors. |
Closes the plot |
|
|
Direct commands sent to the GracePlot to the appropriate GraceGraph. |
|
Shortcut for sending the command to current graceGraph see below |
Return True if the pipe is not known to have been closed. |
|
|
load a grace *.par file |
|
Refresh the plot |
Resets last used symbols and lines. |
|
|
Change the page dimensions (in pixel)for plots with fixed size. |
resolution of the plot |
|
|
Send a list of commands, and then flush |
11.1.2. GraceGraph
|
autoscales axes |
|
Clear plot |
|
Set frame type of graph |
|
Format of axis |
|
Turn on/off overplotting for this graph. |
Kill the plot |
|
|
Place the legend in the plot or update it. |
|
Draws line/arrow in plot. |
|
Plot data in xmgrace |
|
redraw Graph |
Resets last used symbols and lines. |
|
|
Sets the graph subtitle |
|
Writes text to graph at specified position. |
|
Sets the graph title. |
|
Efficiently update the data for a given data set. |
|
Format of axis |
|
Convenience function to set the xaxis label charsize detemines charsize, default 1 |
|
Convenience function to set the lower and/or upper bounds of the x-axis. |
|
Format of axis |
|
Convenience function to set the yaxis label |
|
Convenience function to set the lower and/or upper bounds of the y-axis. |
|
this sets the viewport coords so they are available later for translating string and line coords. |
11.1.3. Helper Classes
|
controls annotation |
|
this class controls the x and y bars in the frame apparently usually it is off onoff is 'on' or 'off' the rest are like everything else |
|
Simplest base class for all GracePlot data objects. |
|
|
|
A data set with a box for an asymmetrical inner error in the 'y' direction and an error bar (whisker) for the asymmetrical outer error bound. |
|
A data set with symmetrical error bars in the 'x' direction |
|
A data set with asymmetrical error bars in the 'x' direction |
|
A data set with asymmetrical error bars in the 'x' and 'y' direction |
|
A data set with symmetrical error bars in the 'x' and 'y' direction |
|
A data set with symmetrical error bars in the 'y' direction |
|
A data set with asymmetrical error bars in the 'y' direction |
|
|
|
class for errorbars |
|
Used for labels of the x-axis and y-axis |
|
Line objekt |
|
Symbol object |
|
Controls appearence of ticks on an axis. |
|
Ticklabels |
|
|
|
|
|
|
|
|
|
|
Thrown when xmgrace unexpectedly disconnects from the pipe. |
|
|
|
|
convert a bool into an xmgrace on/off string |
A high-level Python interface to the Grace plotting package XmGrace
One line command plotting: plot of numpy arrays and dataArrays without predefining Data or Symbol objects.
symbol, line and error are defined by list arguments as line=[1,0.5,3]
Older functionality still works and can be used for more sophisticated output.
How to write special symbols and more see Tips.
Example
import jscatter as js
data=js.dL(js.examples.datapath+'/iqt_1hho.dat')               #read data from test directory into dataList
# open plot with fixed size of 2x3 inch or 2*300x3*300 pixel
p=js.grace(2,1)
p.multi(1,2)
#
p[0].plot(data[:8:2],symbol=[-1,1,-1,''],line=[1,2,''],legend='Q=$q')
p[1].plot(data[1:8:2],sy=[-1,1,-1],li=-1, legend='Q=$q')
#
 # make axes, legend, title, and subtitle to get nice plot
p[0].yaxis(min=0.09,max=1.1,scale='l',label='I(Q,t)/I(Q,0)',charsize=1.50,ticklabel=['power',0,1.3])
p[0].xaxis(min=0.0,max=150,label='fouriertime t / ns ',charsize=1.50)
p[1].xaxis(min=0.9,max=150,scale='log',label='fouriertime t / ns ',charsize=1.50)
p[0].legend(x=110,y=1)
p[0].title(r'An example for the intermediate scattering function in \n Neutron Spinecho Spectroscopy',size=1)
p[0].title('This is GraceGraph 1',size=2)
p[1].title('This is GraceGraph 2',size=2)
p[0].subtitle('colors of lines are sync to symbol color')
# add a text
p[1].text(r'Here we place a text just as demo\n at the last point of this dataset',x=1.2,y=0.3,charsize=1)
# p.save('testdata.agr') #as grace file
# p.save(js.examples.imagepath+'/Graceexample.jpg',format='jpeg',size=[2,1.33]) #as jpg file
some examples using GracePlot
Above;
Smoothed Xray ;
multilamellarVesicles()
Originally, this code of GracePlot started out from: Nathaniel Gray <n8gray@caltech.edu>, updated by Marcus H. Mendenhall, MHM ,John Kitchin, Marus Mendenhall
original source -> sourceforge.net/projects/graceplot/ 2014 and according to that site: License: GNU General Public License version 2.0 (GPLv2)
Consequently this file is still under GNU General Public License version 2.0 (GPLv2)
2019 changed some things to be only python 3 compatible
Ralf Biehl JCNS1 & ICS1 Forschungszentrum Juelich 2014-2019
- class jscatter.graceplot.createColorTable[source]
Bases:
object- property len
- property names
- property list
- class jscatter.graceplot.symbols[source]
Bases:
object- none = np.int64(0)
- circle = np.int64(1)
- square = np.int64(2)
- diamond = np.int64(3)
- triangle_up = np.int64(4)
- triangle_left = np.int64(5)
- triangle_down = np.int64(6)
- triangle_right = np.int64(7)
- plus = np.int64(8)
- cross = np.int64(9)
- star = np.int64(10)
- character = np.int64(11)
- class jscatter.graceplot.lines[source]
Bases:
object- none = np.int64(0)
- solid = np.int64(1)
- dotted = np.int64(2)
- dashed = np.int64(3)
- long_dashed = np.int64(4)
- dot_dashed = np.int64(5)
- class jscatter.graceplot.frames[source]
Bases:
object- closed = 0
- halfopen = 1
- breaktop = 2
- breakbottom = 3
- breakleft = 4
- breakright = 5
- exception jscatter.graceplot.Disconnected[source]
Bases:
ExceptionThrown when xmgrace unexpectedly disconnects from the pipe.
This exception is thrown on an EPIPE error, which indicates that xmgrace has stopped reading the pipe that is used to communicate with it. This could be because it has been closed (e.g., by clicking on the exit button), crashed, or sent an exit command.
- class jscatter.graceplot.GraceGraph(grace, gID, xmin=0.15, xmax=0.95, ymin=0.15, ymax=0.9)[source]
Bases:
objectclass for handling GraceGraph
- Parameters:
- gIDinteger
Graph ID
- xmin,xmax,ymin,ymaxfloat default 0.15,0.95,0.15,0.88
position of edges in plot in relative view coordinates
- autoscale(axis=None)[source]
autoscales axes
- axis‘x’,’y’,None
None, scale all axes, otherwise if it is ‘x’ or ‘y’ scale that axis
- hold(onoff=None)[source]
Turn on/off overplotting for this graph.
Call as hold() to toggle, hold(1) to turn on, or hold(0) to turn off. Returns the previous hold setting.
- title(title=None, font=None, size=None, color=None)[source]
Sets the graph title.
- Parameters:
- titlestring
Title string
- font
Font of title
- sizefloat
Size of title
- colorinteger
Color of title
- subtitle(subtitle=None, font=None, size=None, color=None)[source]
Sets the graph subtitle
see title
- gen_axis(axis_prefix, ax_min=None, ax_max=None, scale=None, invert=None, formula=None, offset=None, label=None, ticklabel=None, charsize=None, size=None, tick=None, bar=None, autotick=True)[source]
Format of axis
- Parameters:
- axis_prefix{‘x’,’y’}
determines axis
- ax_min,ax_maxfloat
min and max of axis
- scale{‘normal’, ‘logarithmic’, or ‘reciprocal’ or respectivly ‘n’,’l’,’r’}
sets type of axis
- labelstring, list or Label object
Label of the axis; see Label object.
string: this is the label string.
list = [label string, charsize, place, color, location]
place : ‘normal’,’both’,’opposite’
location : [parallel, perpendicular] offset from axis center. defauls [0,0.08]
- invert{True,False}
invert axis
- formulagrace equation
formula for ticklabel calculation eg. for rescaling.
$t is label -> scaling as “$t*1e5”
- charsize,sizefloat
determines character size, default 1
- offsetlist of float
determines the position of the normal and opposite axis position
- autotickbool
autoticking
- tickTick object or list, False, True
list of [major tick distance , minorticks number, majorsize, minorsize, position]
position as one of ‘normal’,’both’,’opposite’ (first letter is enough)
False, True switch Ticks on and off
see Tick for more
- ticklabelfloat, list, tickLabel object
With [format,precision,charsize,placeon] or a shortcut
format: ‘decimal’,’exponential’,’general’,’power’,’scientific’
precision : integer
charsize : float
placeon : ‘normal’,’both’,’opposite’
Shortcuts:
‘on’, ‘off’,1,0: switch ticklabel on/off
float: used as charsize
one of format strings: change format (‘power’,’scientific’ with precision=0’)
- bar‘on’,’off’,list or bar object
list=[onoff,color,linestyle,linewidth]
See bar object. ‘on’/’off’ switch on or off.
- xaxis(min=None, max=None, **kwargs)[source]
Format of axis
- Parameters:
- axis_prefix{‘x’,’y’}
determines axis
- ax_min,ax_maxfloat
min and max of axis
- scale{‘normal’, ‘logarithmic’, or ‘reciprocal’ or respectivly ‘n’,’l’,’r’}
sets type of axis
- labelstring, list or Label object
Label of the axis; see Label object.
string: this is the label string.
list = [label string, charsize, place, color, location]
place : ‘normal’,’both’,’opposite’
location : [parallel, perpendicular] offset from axis center. defauls [0,0.08]
- invert{True,False}
invert axis
- formulagrace equation
formula for ticklabel calculation eg. for rescaling.
$t is label -> scaling as “$t*1e5”
- charsize,sizefloat
determines character size, default 1
- offsetlist of float
determines the position of the normal and opposite axis position
- autotickbool
autoticking
- tickTick object or list, False, True
list of [major tick distance , minorticks number, majorsize, minorsize, position]
position as one of ‘normal’,’both’,’opposite’ (first letter is enough)
False, True switch Ticks on and off
see Tick for more
- ticklabelfloat, list, tickLabel object
With [format,precision,charsize,placeon] or a shortcut
format: ‘decimal’,’exponential’,’general’,’power’,’scientific’
precision : integer
charsize : float
placeon : ‘normal’,’both’,’opposite’
Shortcuts:
‘on’, ‘off’,1,0: switch ticklabel on/off
float: used as charsize
one of format strings: change format (‘power’,’scientific’ with precision=0’)
- bar‘on’,’off’,list or bar object
list=[onoff,color,linestyle,linewidth]
See bar object. ‘on’/’off’ switch on or off.
- yaxis(min=None, max=None, **kwargs)[source]
Format of axis
- Parameters:
- axis_prefix{‘x’,’y’}
determines axis
- ax_min,ax_maxfloat
min and max of axis
- scale{‘normal’, ‘logarithmic’, or ‘reciprocal’ or respectivly ‘n’,’l’,’r’}
sets type of axis
- labelstring, list or Label object
Label of the axis; see Label object.
string: this is the label string.
list = [label string, charsize, place, color, location]
place : ‘normal’,’both’,’opposite’
location : [parallel, perpendicular] offset from axis center. defauls [0,0.08]
- invert{True,False}
invert axis
- formulagrace equation
formula for ticklabel calculation eg. for rescaling.
$t is label -> scaling as “$t*1e5”
- charsize,sizefloat
determines character size, default 1
- offsetlist of float
determines the position of the normal and opposite axis position
- autotickbool
autoticking
- tickTick object or list, False, True
list of [major tick distance , minorticks number, majorsize, minorsize, position]
position as one of ‘normal’,’both’,’opposite’ (first letter is enough)
False, True switch Ticks on and off
see Tick for more
- ticklabelfloat, list, tickLabel object
With [format,precision,charsize,placeon] or a shortcut
format: ‘decimal’,’exponential’,’general’,’power’,’scientific’
precision : integer
charsize : float
placeon : ‘normal’,’both’,’opposite’
Shortcuts:
‘on’, ‘off’,1,0: switch ticklabel on/off
float: used as charsize
one of format strings: change format (‘power’,’scientific’ with precision=0’)
- bar‘on’,’off’,list or bar object
list=[onoff,color,linestyle,linewidth]
See bar object. ‘on’/’off’ switch on or off.
- xlimit(lower=None, upper=None)[source]
Convenience function to set the lower and/or upper bounds of the x-axis.
- ylimit(lower=None, upper=None)[source]
Convenience function to set the lower and/or upper bounds of the y-axis.
- xlabel(label, charsize=None)[source]
Convenience function to set the xaxis label charsize detemines charsize, default 1
- clear(slice=slice(None, None, None), hold=0)[source]
Clear plot
- Parameters:
- sliceslice
Selects elements to delete. If ommited clear all. e.g. last for elements slice=slice(-4) don’t use slice extensivly as it could mess up.
- holdbool, default 0
Set/reset to hold lines.
- resetlast()[source]
Resets last used symbols and lines.
lastline=[1,0,0] lastsymbol=[1,0.5,1,0] lasterror=[0,0,0,0]
- legend(strings=None, x=None, y=None, boxcolor=None, boxpattern=None, boxlinewidth=None, boxlinestyle=None, boxfillcolor=None, boxfillpattern=None, font=None, charsize=None, color=None, length=None, vgap=None, hgap=None, invert=None, world_coords=True, offset=0, onoff=True, position=None)[source]
Place the legend in the plot or update it.
- Parameters:
- stringslist of strings,string, default=None
List of legend strings or one string. If None then self.legend_strings is used. self.legend_strings is build from legend attribute in plot
- offsetint, default 0
Which legend string to change if strings is single string >0 with offset shifted =<0 starting from last reverse order default 0 names last legend
- x,y: float
Position of the upper left corner of the box in data coordinates
- boxcolorint
Color of the legend box lines
- boxpatterninteger
Pattern of the legend box lines
- boxlinewidthfloat
Thickness of the line
- boxlinestyle,boxfillcolor,boxfillpatterninteger
As name says
- fontint
Is the font used in the legend
- charsizefloat
Size of the characters
- lengthint
Length of the box must be an integer
- vgapint
Vertical space between entries, can be a float
- hgapfloat
Horizontal spacing in the box can be a float
- invertbool, (True,False)
Order of entries, either in the order they are entered, or the opposite
- onoffbool
Show legend or not
- position‘ll’, ‘ur’, ‘ul’, ‘lr’
Legend position shortcut. Shortcuts for lower left, upper right, upper left, lower right.
- frame(type=None, linestyle=None, linewidth=None, color=None, pattern=None, backgroundcolor=None, backgroundpattern=None)[source]
Set frame type of graph
- Parameters:
- type[0,1,2,3,4,5] => closed,halfopen,breaktop,breakbottom,breakleft,breakright
Boxtype
- linestyleint
Linestyle; see plot
- linewidthfloat
linewidth; see plot
- colorint; see plot
Color
- patternint
Pattern
- backgroundcolorint
Color
- backgroundpatternint
Pattern
Notes
For the different types except of close the axis bar and tick marks need to be removed
- plot(*datasets, **kwargs)[source]
Plot data in xmgrace
e.g. p.plot(data,legend=’description’,symbol=[1,0.5,4],line=[1,2,2],errorbar=[0])
- Parameters:
- datasetsdataArray, dataList,numpy array, lists of them
Several of (comma separated) nonkeyword arguments or as list. If dimension of datasets is one a new Data object is created and plotted see Notes below for error plots.
- symbol,syint, list of float or Symbol object
[symbol,size,color,fillcolor,fillpattern,linewidth] as [1,1,1,-1,2];
single integer to chose symbol e.g.symbol=3; symbol=0 switches off
negative increments from last, non integer repeat last
symbol => 0-11 = ◦,☐,♢,▵,◁,▽,▷,+,×,☆,(11 is char)
size => size, a number e.g.0.5
color => int 0-16 = white,black,red,green,blue,ligth green,brown, darkgrey,violet,orange,magenta,grey
fillcolor=None : set color and adds fillpattern=1, non-integer syncs to symbol color
fillpattern=None 0 empty, 1 full, ….test it
linewidth 0.1-10 width of line for open symbols.
- line,liint, list of float or Line object
[linestyle,linewidth,color] as [1,1,’’];
negative increments;non integer as ‘’ repeats last
single integer to chose line line=1; line=0 switches of
linestyle int 1 normal, 2 dotted, 3 dashed, 4 long dashed, 5 dot-dashed
linewidth float goes from 0 to 6 in increasing thickness
color see symbol color, non-integer syncs to symbol color
- errorbar,erint or list of float or Errorbar object
[color,size,linewidth,riserlinewidth] as [1,1,1,1]; no increment, no repeat
color int see symbol color, non-integer syncs to symbol color
size float default 1.0 ; smaller is 0.5
linewidth float default 1.0
riserlinewidth float default 1.0
- legend,lestring
determines legend for all datasets
string replacement: attr name prepended by ‘$’ (eg. ‘$par’) is replaced by value str(par1.flatten()[0]) if possible. $(par) for not unique names
- comment: string
string determines comment for all datasets
for dataArray: list of attribute values is set as comment to ckeck use dataArray.resumeAttrTxt()
- autoscalebool
default True, False
- internal_autoscalebool
default True, False 10% border
- redrawbool
redraw
Notes
Plot types determined by dimension of dataset
- 1: dataset is type Data instances
See Data class for possibilities and original documentation.
- 2: dataset is numpy array; simplified version
Use slices like data_in_numpyarray[[0,3,2],:] to select columns to plot
len(array)= 2 XY
len(array)= 3 XYDY
len(array)= 4 XYDXDY
- 3: dataset is dataArray ; simplified version
attributes X,Y,eY,eX determine plot type if they exist. So set these before plot by dataset.setColumnIndex(3,4,7)
default is 0,1,2 for X,Y,eY, No eX
Slicing works too as for arrays.
For more complex plots use original Data class in 1. Old style plotting needs creation of GracePlot.Data objects like
d1=Data(x=x,y=y,symbol=GracePlot.Symbol(symbol=circle,fillcolor=red),line=GracePlot.Line(type=none))
or in short abreviation:
d1=Data(x=x,y=y,symbol=[-1,2,3,4],line=[1,2,3])
#plotted sets can be accessed by
p[0].datasets   as a list of Data objects
Examples
tX =np.r_[0:10]
tY=np.sin(tX)
data=np.c_[tX,tY,tY*0.05].T
p=s.grace()                    # open plot
# plot single column data tX,tY,teY
p.plot(tX,tY,legend='all 1D data',symbol=3,line=1,errorbar=[0])
#plot Data with arrray or dataList
p.plot(data,legend='description',symbol=[1,0.5,4],line=[1,2,2],errorbar=[0])
p.yaxis(label='whatever / m')  # change y label
p.legend()                     # show legends
- update_data(set_index, new_x=None, new_y=None, new_dylist=None)[source]
Efficiently update the data for a given data set. set length, etc. must not change!
- shiftbyfactor(xy=None, factor=None, repeat=None, scale='lin', xfactors=None, yfactors=None)[source]
Shift data consecutively by factors
Consecutively multiply by 2 as 2,4,6,8…. or with power laws.
- Parameters:
- xy‘xy’
Selector for x or y axis or both
- factorfloat
Shift factor
- repeatfloat default=number of sets in plot
Repeat number of times the factor 3 -> 2,4,6,2,4,6… for factor=2
- xfactorsarray or list
Factors as list, overrides factor and repeat
- yfactorsarray or list
Factors as list,overrides factor and repeat dylist is also shifted
- scale‘log’, other
If ‘log’ a factor**i is used for logarithmic scale all other factor*i is used
Notes
List is
factor*np.tile(np.r_[1:repeat+1],nSets)  lin scale
factor**np.tile(np.r_[1:repeat+1],nSets)  log scale
Create factors manually e.g. by
np.tile([1,2,3],3)         -->  array([1, 2, 3, 1, 2, 3, 1, 2, 3])
1.1**np.tile([1,1,2],3)    -->  array([1.1, 1.1, 1.21, 1.1, 1.1, 1.21, 1.1, 1.1, 1.21])
#for an inverse shifting
2*np.tile(np.r_[10:1:-1],3)-->  array([20, 18, 16, 14, 12, 10,  8,  6,  4, 20, 18, 16, 14, 12, 10,  8,  6, 4])
- text(string=None, x=None, y=None, color=None, rot=0, font=None, just=None, charsize=None, world_coords=True)[source]
Writes text to graph at specified position.
- Parameters:
- stringstring
Text to print
- x,y: float
Coordinates are the cartesian coordinates of x,y axis
- colorint
Color
- rotfloat
Rotation angle
- fontint
Font as defined in default xmgrace plot
- just
Justification
- charsizefloat
Charsize
- world_coordsbool
World coordinates or viewport coordinates
Notes
Try in Gui for values.
- line(x1=None, y1=None, x2=None, y2=None, linewidth=None, linestyle=None, color=None, arrow=None, arrowtype=None, arrowlength=None, arrowlayout=None, world_coords=True)[source]
Draws line/arrow in plot.
- Parameters:
- x1,y1,x2,y2float
Start and end point. Coordinates are the cartesian cooridinates for a single graph.
- linewidthfloat
Width
- linestyleint
Style
- colorint
Color
- arrowint
Tells where the arrowhead is and is 0,1,2, or 3 for none, start, end, both ends
- arrowtypeint
Is for line (0), filled (1), or opaque (2), and only have an effect if the arrowlayout is not (1,1)
- arrowlayout[int,int]
Must be a list of 2 numbers, arrowlayout=(1,1) the first number relates to d/L and the second is I/L the meaning of which is unclear, but they affect the arrow shape.
Examples
import jscatter as js
import numpy as np

p = js.grace()
p.xaxis(min=0,max=1)
p.yaxis(min=0, max=1)
a,b,c = 0,0,1
for x,y in np.random.random(20).reshape([10,-1]):
   p[0].line(x,y,a,b,linewidth=c,linestyle=c,color=c,arrow=1)
   a,b = x,y
   c+=1
- SetView(xmin=None, ymin=None, xmax=None, ymax=None, aspect_scaled=True)[source]
this sets the viewport coords so they are available later for translating string and line coords.
- Parameters:
- xmin,xmax,ymin,ymaxfloat
view range
- aspect_scaledbool
aspect
- Plot(*datasets, **kwargs)
Plot data in xmgrace
e.g. p.plot(data,legend=’description’,symbol=[1,0.5,4],line=[1,2,2],errorbar=[0])
- Parameters:
- datasetsdataArray, dataList,numpy array, lists of them
Several of (comma separated) nonkeyword arguments or as list. If dimension of datasets is one a new Data object is created and plotted see Notes below for error plots.
- symbol,syint, list of float or Symbol object
[symbol,size,color,fillcolor,fillpattern,linewidth] as [1,1,1,-1,2];
single integer to chose symbol e.g.symbol=3; symbol=0 switches off
negative increments from last, non integer repeat last
symbol => 0-11 = ◦,☐,♢,▵,◁,▽,▷,+,×,☆,(11 is char)
size => size, a number e.g.0.5
color => int 0-16 = white,black,red,green,blue,ligth green,brown, darkgrey,violet,orange,magenta,grey
fillcolor=None : set color and adds fillpattern=1, non-integer syncs to symbol color
fillpattern=None 0 empty, 1 full, ….test it
linewidth 0.1-10 width of line for open symbols.
- line,liint, list of float or Line object
[linestyle,linewidth,color] as [1,1,’’];
negative increments;non integer as ‘’ repeats last
single integer to chose line line=1; line=0 switches of
linestyle int 1 normal, 2 dotted, 3 dashed, 4 long dashed, 5 dot-dashed
linewidth float goes from 0 to 6 in increasing thickness
color see symbol color, non-integer syncs to symbol color
- errorbar,erint or list of float or Errorbar object
[color,size,linewidth,riserlinewidth] as [1,1,1,1]; no increment, no repeat
color int see symbol color, non-integer syncs to symbol color
size float default 1.0 ; smaller is 0.5
linewidth float default 1.0
riserlinewidth float default 1.0
- legend,lestring
determines legend for all datasets
string replacement: attr name prepended by ‘$’ (eg. ‘$par’) is replaced by value str(par1.flatten()[0]) if possible. $(par) for not unique names
- comment: string
string determines comment for all datasets
for dataArray: list of attribute values is set as comment to ckeck use dataArray.resumeAttrTxt()
- autoscalebool
default True, False
- internal_autoscalebool
default True, False 10% border
- redrawbool
redraw
Notes
Plot types determined by dimension of dataset
- 1: dataset is type Data instances
See Data class for possibilities and original documentation.
- 2: dataset is numpy array; simplified version
Use slices like data_in_numpyarray[[0,3,2],:] to select columns to plot
len(array)= 2 XY
len(array)= 3 XYDY
len(array)= 4 XYDXDY
- 3: dataset is dataArray ; simplified version
attributes X,Y,eY,eX determine plot type if they exist. So set these before plot by dataset.setColumnIndex(3,4,7)
default is 0,1,2 for X,Y,eY, No eX
Slicing works too as for arrays.
For more complex plots use original Data class in 1. Old style plotting needs creation of GracePlot.Data objects like
d1=Data(x=x,y=y,symbol=GracePlot.Symbol(symbol=circle,fillcolor=red),line=GracePlot.Line(type=none))
or in short abreviation:
d1=Data(x=x,y=y,symbol=[-1,2,3,4],line=[1,2,3])
#plotted sets can be accessed by
p[0].datasets   as a list of Data objects
Examples
tX =np.r_[0:10]
tY=np.sin(tX)
data=np.c_[tX,tY,tY*0.05].T
p=s.grace()                    # open plot
# plot single column data tX,tY,teY
p.plot(tX,tY,legend='all 1D data',symbol=3,line=1,errorbar=[0])
#plot Data with arrray or dataList
p.plot(data,legend='description',symbol=[1,0.5,4],line=[1,2,2],errorbar=[0])
p.yaxis(label='whatever / m')  # change y label
p.legend()                     # show legends
- Title(title=None, font=None, size=None, color=None)
Sets the graph title.
- Parameters:
- titlestring
Title string
- font
Font of title
- sizefloat
Size of title
- colorinteger
Color of title
- Subtitle(subtitle=None, font=None, size=None, color=None)
Sets the graph subtitle
see title
- Yaxis(min=None, max=None, **kwargs)
Format of axis
- Parameters:
- axis_prefix{‘x’,’y’}
determines axis
- ax_min,ax_maxfloat
min and max of axis
- scale{‘normal’, ‘logarithmic’, or ‘reciprocal’ or respectivly ‘n’,’l’,’r’}
sets type of axis
- labelstring, list or Label object
Label of the axis; see Label object.
string: this is the label string.
list = [label string, charsize, place, color, location]
place : ‘normal’,’both’,’opposite’
location : [parallel, perpendicular] offset from axis center. defauls [0,0.08]
- invert{True,False}
invert axis
- formulagrace equation
formula for ticklabel calculation eg. for rescaling.
$t is label -> scaling as “$t*1e5”
- charsize,sizefloat
determines character size, default 1
- offsetlist of float
determines the position of the normal and opposite axis position
- autotickbool
autoticking
- tickTick object or list, False, True
list of [major tick distance , minorticks number, majorsize, minorsize, position]
position as one of ‘normal’,’both’,’opposite’ (first letter is enough)
False, True switch Ticks on and off
see Tick for more
- ticklabelfloat, list, tickLabel object
With [format,precision,charsize,placeon] or a shortcut
format: ‘decimal’,’exponential’,’general’,’power’,’scientific’
precision : integer
charsize : float
placeon : ‘normal’,’both’,’opposite’
Shortcuts:
‘on’, ‘off’,1,0: switch ticklabel on/off
float: used as charsize
one of format strings: change format (‘power’,’scientific’ with precision=0’)
- bar‘on’,’off’,list or bar object
list=[onoff,color,linestyle,linewidth]
See bar object. ‘on’/’off’ switch on or off.
- Xaxis(min=None, max=None, **kwargs)
Format of axis
- Parameters:
- axis_prefix{‘x’,’y’}
determines axis
- ax_min,ax_maxfloat
min and max of axis
- scale{‘normal’, ‘logarithmic’, or ‘reciprocal’ or respectivly ‘n’,’l’,’r’}
sets type of axis
- labelstring, list or Label object
Label of the axis; see Label object.
string: this is the label string.
list = [label string, charsize, place, color, location]
place : ‘normal’,’both’,’opposite’
location : [parallel, perpendicular] offset from axis center. defauls [0,0.08]
- invert{True,False}
invert axis
- formulagrace equation
formula for ticklabel calculation eg. for rescaling.
$t is label -> scaling as “$t*1e5”
- charsize,sizefloat
determines character size, default 1
- offsetlist of float
determines the position of the normal and opposite axis position
- autotickbool
autoticking
- tickTick object or list, False, True
list of [major tick distance , minorticks number, majorsize, minorsize, position]
position as one of ‘normal’,’both’,’opposite’ (first letter is enough)
False, True switch Ticks on and off
see Tick for more
- ticklabelfloat, list, tickLabel object
With [format,precision,charsize,placeon] or a shortcut
format: ‘decimal’,’exponential’,’general’,’power’,’scientific’
precision : integer
charsize : float
placeon : ‘normal’,’both’,’opposite’
Shortcuts:
‘on’, ‘off’,1,0: switch ticklabel on/off
float: used as charsize
one of format strings: change format (‘power’,’scientific’ with precision=0’)
- bar‘on’,’off’,list or bar object
list=[onoff,color,linestyle,linewidth]
See bar object. ‘on’/’off’ switch on or off.
- Clear(slice=slice(None, None, None), hold=0)
Clear plot
- Parameters:
- sliceslice
Selects elements to delete. If ommited clear all. e.g. last for elements slice=slice(-4) don’t use slice extensivly as it could mess up.
- holdbool, default 0
Set/reset to hold lines.
- Legend(strings=None, x=None, y=None, boxcolor=None, boxpattern=None, boxlinewidth=None, boxlinestyle=None, boxfillcolor=None, boxfillpattern=None, font=None, charsize=None, color=None, length=None, vgap=None, hgap=None, invert=None, world_coords=True, offset=0, onoff=True, position=None)
Place the legend in the plot or update it.
- Parameters:
- stringslist of strings,string, default=None
List of legend strings or one string. If None then self.legend_strings is used. self.legend_strings is build from legend attribute in plot
- offsetint, default 0
Which legend string to change if strings is single string >0 with offset shifted =<0 starting from last reverse order default 0 names last legend
- x,y: float
Position of the upper left corner of the box in data coordinates
- boxcolorint
Color of the legend box lines
- boxpatterninteger
Pattern of the legend box lines
- boxlinewidthfloat
Thickness of the line
- boxlinestyle,boxfillcolor,boxfillpatterninteger
As name says
- fontint
Is the font used in the legend
- charsizefloat
Size of the characters
- lengthint
Length of the box must be an integer
- vgapint
Vertical space between entries, can be a float
- hgapfloat
Horizontal spacing in the box can be a float
- invertbool, (True,False)
Order of entries, either in the order they are entered, or the opposite
- onoffbool
Show legend or not
- position‘ll’, ‘ur’, ‘ul’, ‘lr’
Legend position shortcut. Shortcuts for lower left, upper right, upper left, lower right.
- Autoscale(axis=None)
autoscales axes
- axis‘x’,’y’,None
None, scale all axes, otherwise if it is ‘x’ or ‘y’ scale that axis
- class jscatter.graceplot.GracePlot(width=None, height=None, auto_redraw=True, redraw_interval=0.1, headless=False, size=None)[source]
Bases:
objectOpen a Figure that will contain several graceGraph.
Default resolution is 300 dpi
- Parameters:
- widthfloat
Page width in inch, pixel width = width*resolution = width*300
- heightfloat
Page height in inch, pixel height = height*resolution = height*300
- auto_redrawbool
Redraw
- redraw_intervalfloat
Time between redraw.
- headlessbool
Use plot in nonGui mode (headless). Save Plot using save method and inspect later.
- Returns:
- GracePlotGracePlot instance
Notes
default resolution is 300 dpi
Create a GracePlot object, which manages an external grace instance. The instance may have multiple GraceGraph objects within it. Commands which are specific to a graph (such as plotting data) are sent to the graph object. Commanbds which are global (such as redraw control) are sent to the GracePlot object.
width*resolution=width in pixels, same for height. Resolution is set to 300 by default, so width is roughly inches on an 300 dpi monitor. By changing the class default resolution, you can change the units of width & height.
If auto_redraw is True, the graph will automatically hold off redrawing until data stops being sent for a time of redraw_interval (seconds).
To force an immediate redraw, call GracePlot.redraw(force=True). Calling GracePlot.redraw() without an argument schedules a redraw at the next quiet interval. This mechanism greatly reduces thrashing of grace windows by repeated un-needed redraws.
To force a redraw on the next cycle of the redrawing thread, call GracePlot.redraw(soon=True). This will cause a redraw even if there is still data flowing, but not in a hurry.
The GracePlot class does all its data transmission through a thread, so usually there should be no significant time during which the calling thread is blocked. This should improve real-time performance.
- resolution = 300
resolution of the plot
- command_args = ('-nosafe', '-noask')
- headless = False
- grace_command = b''
- focus(graph_index=None, grace_graph=None)[source]
Direct commands sent to the GracePlot to the appropriate GraceGraph.
Mostly for backwards compatibility. It is preferable to send the commands directly to the plot:
p[2].plot(....)
- new_graph(**kwargs)[source]
Add a new graph to plot.
- Parameters:
- xmin,xmax,ymin,ymaxfloat; default 0.15,0.95,0.15,0.88
Position of edges in plot in relative view coordinates
- plot(*args, **kwargs)[source]
Shortcut for sending the command directly to the appropriate graceGraph object see below
Plot data in xmgrace
e.g. p.plot(data,legend=’description’,symbol=[1,0.5,4],line=[1,2,2],errorbar=[0])
- Parameters:
- datasetsdataArray, dataList,numpy array, lists of them
Several of (comma separated) nonkeyword arguments or as list. If dimension of datasets is one a new Data object is created and plotted see Notes below for error plots.
- symbol,syint, list of float or Symbol object
[symbol,size,color,fillcolor,fillpattern,linewidth] as [1,1,1,-1,2];
single integer to chose symbol e.g.symbol=3; symbol=0 switches off
negative increments from last, non integer repeat last
symbol => 0-11 = ◦,☐,♢,▵,◁,▽,▷,+,×,☆,(11 is char)
size => size, a number e.g.0.5
color => int 0-16 = white,black,red,green,blue,ligth green,brown, darkgrey,violet,orange,magenta,grey
fillcolor=None : set color and adds fillpattern=1, non-integer syncs to symbol color
fillpattern=None 0 empty, 1 full, ….test it
linewidth 0.1-10 width of line for open symbols.
- line,liint, list of float or Line object
[linestyle,linewidth,color] as [1,1,’’];
negative increments;non integer as ‘’ repeats last
single integer to chose line line=1; line=0 switches of
linestyle int 1 normal, 2 dotted, 3 dashed, 4 long dashed, 5 dot-dashed
linewidth float goes from 0 to 6 in increasing thickness
color see symbol color, non-integer syncs to symbol color
- errorbar,erint or list of float or Errorbar object
[color,size,linewidth,riserlinewidth] as [1,1,1,1]; no increment, no repeat
color int see symbol color, non-integer syncs to symbol color
size float default 1.0 ; smaller is 0.5
linewidth float default 1.0
riserlinewidth float default 1.0
- legend,lestring
determines legend for all datasets
string replacement: attr name prepended by ‘$’ (eg. ‘$par’) is replaced by value str(par1.flatten()[0]) if possible. $(par) for not unique names
- comment: string
string determines comment for all datasets
for dataArray: list of attribute values is set as comment to ckeck use dataArray.resumeAttrTxt()
- autoscalebool
default True, False
- internal_autoscalebool
default True, False 10% border
- redrawbool
redraw
Notes
Plot types determined by dimension of dataset
- 1: dataset is type Data instances
See Data class for possibilities and original documentation.
- 2: dataset is numpy array; simplified version
Use slices like data_in_numpyarray[[0,3,2],:] to select columns to plot
len(array)= 2 XY
len(array)= 3 XYDY
len(array)= 4 XYDXDY
- 3: dataset is dataArray ; simplified version
attributes X,Y,eY,eX determine plot type if they exist. So set these before plot by dataset.setColumnIndex(3,4,7)
default is 0,1,2 for X,Y,eY, No eX
Slicing works too as for arrays.
For more complex plots use original Data class in 1. Old style plotting needs creation of GracePlot.Data objects like
d1=Data(x=x,y=y,symbol=GracePlot.Symbol(symbol=circle,fillcolor=red),line=GracePlot.Line(type=none))
or in short abreviation:
d1=Data(x=x,y=y,symbol=[-1,2,3,4],line=[1,2,3])
#plotted sets can be accessed by
p[0].datasets   as a list of Data objects
Examples
tX =np.r_[0:10]
tY=np.sin(tX)
data=np.c_[tX,tY,tY*0.05].T
p=s.grace()                    # open plot
# plot single column data tX,tY,teY
p.plot(tX,tY,legend='all 1D data',symbol=3,line=1,errorbar=[0])
#plot Data with arrray or dataList
p.plot(data,legend='description',symbol=[1,0.5,4],line=[1,2,2],errorbar=[0])
p.yaxis(label='whatever / m')  # change y label
p.legend()                     # show legends
- SetView(*args, **kwargs)[source]
Shortcut for sending the command directly to the appropriate graceGraph object see below
this sets the viewport coords so they are available later for translating string and line coords.
- Parameters:
- xmin,xmax,ymin,ymaxfloat
view range
- aspect_scaledbool
aspect
- shiftbyfactor(*args, **kwargs)[source]
Shortcut for sending the command directly to the appropriate graceGraph object see below
Shift data consecutively by factors
Consecutively multiply by 2 as 2,4,6,8…. or with power laws.
- Parameters:
- xy‘xy’
Selector for x or y axis or both
- factorfloat
Shift factor
- repeatfloat default=number of sets in plot
Repeat number of times the factor 3 -> 2,4,6,2,4,6… for factor=2
- xfactorsarray or list
Factors as list, overrides factor and repeat
- yfactorsarray or list
Factors as list,overrides factor and repeat dylist is also shifted
- scale‘log’, other
If ‘log’ a factor**i is used for logarithmic scale all other factor*i is used
Notes
List is
factor*np.tile(np.r_[1:repeat+1],nSets)  lin scale
factor**np.tile(np.r_[1:repeat+1],nSets)  log scale
Create factors manually e.g. by
np.tile([1,2,3],3)         -->  array([1, 2, 3, 1, 2, 3, 1, 2, 3])
1.1**np.tile([1,1,2],3)    -->  array([1.1, 1.1, 1.21, 1.1, 1.1, 1.21, 1.1, 1.1, 1.21])
#for an inverse shifting
2*np.tile(np.r_[10:1:-1],3)-->  array([20, 18, 16, 14, 12, 10,  8,  6,  4, 20, 18, 16, 14, 12, 10,  8,  6, 4])
- legend(*args, **kwargs)[source]
Shortcut for sending the command to current graceGraph
Place the legend in the plot or update it.
- Parameters:
- stringslist of strings,string, default=None
List of legend strings or one string. If None then self.legend_strings is used. self.legend_strings is build from legend attribute in plot
- offsetint, default 0
Which legend string to change if strings is single string >0 with offset shifted =<0 starting from last reverse order default 0 names last legend
- x,y: float
Position of the upper left corner of the box in data coordinates
- boxcolorint
Color of the legend box lines
- boxpatterninteger
Pattern of the legend box lines
- boxlinewidthfloat
Thickness of the line
- boxlinestyle,boxfillcolor,boxfillpatterninteger
As name says
- fontint
Is the font used in the legend
- charsizefloat
Size of the characters
- lengthint
Length of the box must be an integer
- vgapint
Vertical space between entries, can be a float
- hgapfloat
Horizontal spacing in the box can be a float
- invertbool, (True,False)
Order of entries, either in the order they are entered, or the opposite
- onoffbool
Show legend or not
- position‘ll’, ‘ur’, ‘ul’, ‘lr’
Legend position shortcut. Shortcuts for lower left, upper right, upper left, lower right.
- clear(*args, **kwargs)[source]
Shortcut for sending the command to current graceGraph see below
Clear plot
- Parameters:
- sliceslice
Selects elements to delete. If ommited clear all. e.g. last for elements slice=slice(-4) don’t use slice extensivly as it could mess up.
- holdbool, default 0
Set/reset to hold lines.
- hold(*args, **kwargs)[source]
Shortcut for sending the command to current graceGraph see below
Turn on/off overplotting for this graph.
Call as hold() to toggle, hold(1) to turn on, or hold(0) to turn off. Returns the previous hold setting.
- title(*args, **kwargs)[source]
Shortcut for sending the command to current graceGraph see below
Sets the graph title.
- Parameters:
- titlestring
Title string
- font
Font of title
- sizefloat
Size of title
- colorinteger
Color of title
- subtitle(*args, **kwargs)[source]
Shortcut for sending the command to current graceGraph see below
Sets the graph subtitle
see title
- xaxis(*args, **kwargs)[source]
Shortcut for sending the command to current graceGraph
Format of axis
- Parameters:
- axis_prefix{‘x’,’y’}
determines axis
- ax_min,ax_maxfloat
min and max of axis
- scale{‘normal’, ‘logarithmic’, or ‘reciprocal’ or respectivly ‘n’,’l’,’r’}
sets type of axis
- labelstring, list or Label object
Label of the axis; see Label object.
string: this is the label string.
list = [label string, charsize, place, color, location]
place : ‘normal’,’both’,’opposite’
location : [parallel, perpendicular] offset from axis center. defauls [0,0.08]
- invert{True,False}
invert axis
- formulagrace equation
formula for ticklabel calculation eg. for rescaling.
$t is label -> scaling as “$t*1e5”
- charsize,sizefloat
determines character size, default 1
- offsetlist of float
determines the position of the normal and opposite axis position
- autotickbool
autoticking
- tickTick object or list, False, True
list of [major tick distance , minorticks number, majorsize, minorsize, position]
position as one of ‘normal’,’both’,’opposite’ (first letter is enough)
False, True switch Ticks on and off
see Tick for more
- ticklabelfloat, list, tickLabel object
With [format,precision,charsize,placeon] or a shortcut
format: ‘decimal’,’exponential’,’general’,’power’,’scientific’
precision : integer
charsize : float
placeon : ‘normal’,’both’,’opposite’
Shortcuts:
‘on’, ‘off’,1,0: switch ticklabel on/off
float: used as charsize
one of format strings: change format (‘power’,’scientific’ with precision=0’)
- bar‘on’,’off’,list or bar object
list=[onoff,color,linestyle,linewidth]
See bar object. ‘on’/’off’ switch on or off.
- yaxis(*args, **kwargs)[source]
Shortcut for sending the command to current graceGraph
Format of axis
- Parameters:
- axis_prefix{‘x’,’y’}
determines axis
- ax_min,ax_maxfloat
min and max of axis
- scale{‘normal’, ‘logarithmic’, or ‘reciprocal’ or respectivly ‘n’,’l’,’r’}
sets type of axis
- labelstring, list or Label object
Label of the axis; see Label object.
string: this is the label string.
list = [label string, charsize, place, color, location]
place : ‘normal’,’both’,’opposite’
location : [parallel, perpendicular] offset from axis center. defauls [0,0.08]
- invert{True,False}
invert axis
- formulagrace equation
formula for ticklabel calculation eg. for rescaling.
$t is label -> scaling as “$t*1e5”
- charsize,sizefloat
determines character size, default 1
- offsetlist of float
determines the position of the normal and opposite axis position
- autotickbool
autoticking
- tickTick object or list, False, True
list of [major tick distance , minorticks number, majorsize, minorsize, position]
position as one of ‘normal’,’both’,’opposite’ (first letter is enough)
False, True switch Ticks on and off
see Tick for more
- ticklabelfloat, list, tickLabel object
With [format,precision,charsize,placeon] or a shortcut
format: ‘decimal’,’exponential’,’general’,’power’,’scientific’
precision : integer
charsize : float
placeon : ‘normal’,’both’,’opposite’
Shortcuts:
‘on’, ‘off’,1,0: switch ticklabel on/off
float: used as charsize
one of format strings: change format (‘power’,’scientific’ with precision=0’)
- bar‘on’,’off’,list or bar object
list=[onoff,color,linestyle,linewidth]
See bar object. ‘on’/’off’ switch on or off.
- xlabel(*args, **kwargs)[source]
- Shortcut for sending the command to current graceGraph
see below
- Convenience function to set the xaxis label
charsize detemines charsize, default 1
- ylabel(*args, **kwargs)[source]
- Shortcut for sending the command to current graceGraph
see below
Convenience function to set the yaxis label
- xlimit(*args, **kwargs)[source]
- Shortcut for sending the command to current graceGraph
see below
Convenience function to set the lower and/or upper bounds of the x-axis.
- ylimit(*args, **kwargs)[source]
- Shortcut for sending the command to current graceGraph
see below
Convenience function to set the lower and/or upper bounds of the y-axis.
- resetlast()[source]
Resets last used symbols and lines.
lastline=[1,0,0] lastsymbol=[1,0.5,1,0] lasterror=[0,0,0,0]
- text(*args, **kwargs)[source]
Writes text to graph at specified position.
- Parameters:
- stringstring
Text to print
- x,y: float
Coordinates are the cartesian coordinates of x,y axis
- colorint
Color
- rotfloat
Rotation angle
- fontint
Font as defined in default xmgrace plot
- just
Justification
- charsizefloat
Charsize
- world_coordsbool
World coordinates or viewport coordinates
Notes
Try in Gui for values.
- multi(rows, cols, offset=0.13, hgap=0.1, vgap=0.15)[source]
Create a grid of graphs with the given number of <rows> and <cols>
Arrange existing graphs (or add extra if needed) to form an nrows by ncols matrix, leaving offset at each page edge with hgap and vgap relative horizontal and vertical spacings
- Parameters:
- rows,colsinteger
Number of graphs
- offsetfloat
Offset from edges
- hgap,vgapfloat
Horizontal, vertical gap between plots
Notes
Overmuch graphs are deleted
- stacked(number, hshift, vshift, frame=None, yaxis='off', yaxisnumber=0, frametype=0, framepattern=1)[source]
Creates a stacked chart with shifted graphs in the frame
Already exsiting graphs are reused, fineadjustement needs to be done by hand.
- Parameters:
- numberint
Number of graphs
- hshiftfloat
Horizontal shift in viewport coords
- vshiftfloat
Vertikal shift in viewport coords
- yaxis‘normal’,’opposite’,’both’,default ‘off’
Where to place the yaxis
- framepatternint
Frame pattern type; 1 is No frame
- frame[float,float,float,float], default [0.15,0.15,0.9,0.9]
Frame size in viewport coordinates [0..1]
- yaxisnumberint
Framenumber where to place yaxis
- frametypeint
Frametype 0=closed,1=halfopen,2,3,4,5= break at top,bottom,left,right
- framepattern
0= None, 1=full,…..and so on
Examples
p.stacked(10,hshift=0.02,vshift=0.01,yaxis='off')
p.stacked(10,hshift=-0.015,vshift=-0.01,yaxis='off')
#create a stacked chart of 10 plots
# each shifted by hshift,vshift
#the yaxis is switched off for all except the first
x=np.r_[0:5:100j]
p=js.grace()
p.stacked(10,hshift=0.02,vshift=0.01,yaxis='off')
#plot some Gaussians
for i in np.arange(10):p[i].plot(x,(i+1)*np.exp(-((x-2)*3)**2),li=[1,2,i+1],sy=0)
#choose the same yscale for the data but no ticks for the later plots
p.g[0].yaxis(min=0,max=10)
for pp in p.g[1:]:pp.yaxis(min=0,max=10,tick=False)
#adjusting the scale and the size of the xaxis ticks
for pp in p:pp.xaxis(tick=[1,1,0.3,0.1])
p[0].yaxis(tick=[1,1,0.3,0.1])
- updateall()[source]
Update the GUI (graph and set selectors etc) to reflect the current project state
- send_commands(*commands)[source]
Send a list of commands, and then flush
- Parameters:
- commandslist of strings
- save(filename, size=(3.4, 2.4), dpi=300, format=None)[source]
Save the current plot.
- Parameters:
- filenamestring
If filename has extension this is used instead of format.
- size(float, float)
Size in inch. For PRL and other papers: Figures should be planned for the column width (8.4 cm or 3 3/8 = 3.4 in.) with 600 dpi:
150 dpi (ok in Powerpoint as png )
300 dpi (default) for fast printing
600 dpi (paper ready quality e.g. as eps, jpg or png)
svg or pdf are vector graphics and scale their resolution.
- dpiin
- Resolution in dots per inch (2.54 cm)
format : string x11, postscript, eps, pdf, mif, svg, pnm, jpeg, png, metafile
- formatDefault is Grace ‘.agr’ file
‘agr’, ‘eps’, ‘jpeg’, ‘metafile’, ‘mif’, ‘pdf’, ‘png’, ‘pnm’, ‘postscript’, ‘svg’, ‘x11’
Notes
Not all drivers are created equal. For caveats that apply to some of these formats see the Grace documentation.
- resize(xdim, ydim)[source]
Change the page dimensions (in pixel)for plots with fixed size.
- Parameters:
- xdim, ydimint
dimension in pixel
- assign_color(idx, rgb, name)[source]
Assign color to an index including new colors.
- Parameters:
- idxint (0..16..)
Index of color.
- rgbset of integer (0..255)
RGB color as (0,0,0)
- namestring
New name of color.
Notes
If used indices are changed the corresponding elements using this are changed too. This means changing index 1 (usually black) used for the axes changes axes color.
More can be used.
Examples
Set color 4 to (0, 0, 255) as blue
assign_color(4, (0,0,255), 'blue')
Append a list of new colors and use them in plot
x=np.r_[1:10]
p=js.grace()
p.colors.list    # shows actual color list
NN=40
clist=np.c_[np.r_[1:NN+1],np.r_[255:0:NN*1j].round(),np.r_[255:0:NN*1j].round(),np.r_[0:255:NN*1j].round()]
for i,r,g,b in clist:
   p.assign_color(i+15,(r,g,b),'test%.2g' %i)
for i in np.r_[1:p.colors.len]:
   p.plot(x,x+i,sy=[1,0.7,p.colors.len-i],li=[1,5,i])
reassign colors
clist=np.c_[np.r_[1:NN+1],np.r_[0:255:NN*1j].round(),np.r_[255:0:NN*1j].round(),np.r_[0:255:NN*1j].round()]
for i,r,g,b in clist:
   p.assign_color(i+15,(r,g,b),'test%.2g' %i)
reassign colors grey scale:
clist=np.c_[np.r_[1:NN+1],np.r_[0:255:NN*1j].round(),np.r_[0:255:NN*1j].round(),np.r_[0:255:NN*1j].round()]
for i,r,g,b in clist:
   p.assign_color(i+15,(r,g,b),'test%.2g' %i)
- Clear(*args, **kwargs)
Shortcut for sending the command to current graceGraph see below
Clear plot
- Parameters:
- sliceslice
Selects elements to delete. If ommited clear all. e.g. last for elements slice=slice(-4) don’t use slice extensivly as it could mess up.
- holdbool, default 0
Set/reset to hold lines.
- Exit()
Nuke the grace session.
- Save(filename, size=(3.4, 2.4), dpi=300, format=None)
Save the current plot.
- Parameters:
- filenamestring
If filename has extension this is used instead of format.
- size(float, float)
Size in inch. For PRL and other papers: Figures should be planned for the column width (8.4 cm or 3 3/8 = 3.4 in.) with 600 dpi:
150 dpi (ok in Powerpoint as png )
300 dpi (default) for fast printing
600 dpi (paper ready quality e.g. as eps, jpg or png)
svg or pdf are vector graphics and scale their resolution.
- dpiin
- Resolution in dots per inch (2.54 cm)
format : string x11, postscript, eps, pdf, mif, svg, pnm, jpeg, png, metafile
- formatDefault is Grace ‘.agr’ file
‘agr’, ‘eps’, ‘jpeg’, ‘metafile’, ‘mif’, ‘pdf’, ‘png’, ‘pnm’, ‘postscript’, ‘svg’, ‘x11’
Notes
Not all drivers are created equal. For caveats that apply to some of these formats see the Grace documentation.
- Multi(rows, cols, offset=0.13, hgap=0.1, vgap=0.15)
Create a grid of graphs with the given number of <rows> and <cols>
Arrange existing graphs (or add extra if needed) to form an nrows by ncols matrix, leaving offset at each page edge with hgap and vgap relative horizontal and vertical spacings
- Parameters:
- rows,colsinteger
Number of graphs
- offsetfloat
Offset from edges
- hgap,vgapfloat
Horizontal, vertical gap between plots
Notes
Overmuch graphs are deleted
- class jscatter.graceplot.Data(x=None, y=None, symbol=None, line=None, legend='', comment=None, errorbar=None, pairs=None, dylist=None, **kwargs)[source]
Bases:
objectSimplest base class for all GracePlot data objects.
- dataset_type_name = 'xy'
- x_format_string = '%s'
- y_format_string = '%s'
- class jscatter.graceplot.DataXYDY(x, y, dy, **kwargs)[source]
Bases:
DataA data set with symmetrical error bars in the ‘y’ direction
- dataset_type_name = 'xydy'
- class jscatter.graceplot.DataXYDX(x, y, dx, **kwargs)[source]
Bases:
DataA data set with symmetrical error bars in the ‘x’ direction
- dataset_type_name = 'xydx'
- class jscatter.graceplot.DataXYDYDY(x, y, dy_down, dy_up, **kwargs)[source]
Bases:
DataA data set with asymmetrical error bars in the ‘y’ direction
- dataset_type_name = 'xydydy'
- class jscatter.graceplot.DataXYDXDX(x, y, dx_left, dx_right, **kwargs)[source]
Bases:
DataA data set with asymmetrical error bars in the ‘x’ direction
- dataset_type_name = 'xydxdx'
- class jscatter.graceplot.DataXYDXDY(x, y, dx, dy, **kwargs)[source]
Bases:
DataA data set with symmetrical error bars in the ‘x’ and ‘y’ direction
- dataset_type_name = 'xydxdy'
- class jscatter.graceplot.DataXYDXDXDYDY(x, y, dx_left, dx_right, dy_down, dy_up, **kwargs)[source]
Bases:
DataA data set with asymmetrical error bars in the ‘x’ and ‘y’ direction
- dataset_type_name = 'xydxdxdydy'
- class jscatter.graceplot.DataXYBoxWhisker(x, y, whisker_down, box_down, whisker_up, box_up, **kwargs)[source]
Bases:
DataA data set with a box for an asymmetrical inner error in the ‘y’ direction and an error bar (whisker) for the asymmetrical outer error bound. The symbol properties set the color (etc.) of the box. The errorbar properties set the color (etc.) of the whisker
- dataset_type_name = 'xyboxplot'
- class jscatter.graceplot.DataBar(x=None, y=None, symbol=None, line=None, legend='', comment=None, errorbar=None, pairs=None, dylist=None, **kwargs)[source]
Bases:
Data- dataset_type_name = 'bar'
- class jscatter.graceplot.Symbol(type=None, symbol=None, size=None, color=1, pattern=None, linewidth=None, linestyle=None, filltype=None, fillrule=None, fillcolor=None, fillpattern=None, char=None, charfont=None, skip=None, annotation=None, errorbar=None)[source]
Bases:
objectSymbol object
- Parameters:
- typeNone,’xy’,’xydy’,’xydxdy’,….,’bar’ ==> 0, 1, 2, 3, ….. 0
None is automatic determination inside grace
- symbol(0..11)
0 None, 1 circle, 2 square, 3 diamond, 4 triangle up, 5 triangle left, 6 triangle down, 7 triangle right, 8 +, 9 x, 10 *, 11 character,
- sizefloat
Self explanatory, 0.5 is 50 in the GUI
- patternint 0-24
The pattern of the outline of the symbol, usually it will be 1
- linewidthfloat
thickness of the outline of the symbol
- linestyleint
0 None, 1 solid, 2 points, 3 broken line
- fillcolorint
color the symbol is filled with, by default it is the same as the outline color.
- fillpatternint, 0..24
pattern of the fill, 1 is solid, 0 is None, there are about 24 choices as dotted, dashed, squared.
- class jscatter.graceplot.Line(type=None, linestyle=None, linewidth=None, color=None, pattern=None, baselinetype=None, baseline=None, dropline=None)[source]
Bases:
objectLine objekt
- Parameters:
- type: int
0 None; 1 straigth; 2 left_stairs; 3 right_stairs; 4 Segments; 5 3-Segments
- linestyleint
1 is normal; 2 is dotted; 3 is dashed; 4 is long dashed; 5 is dot-dashed
- linewidthfloat
goes from 0 to 6 in increasing thickness
- colorint
color
- patternint
fill pattern 1 is solid, 0 is None, there are about 24 choices as dotted, dashed, squared.
- baselineint
show baseline
- baselinetypeint
0 Zero; 1 set min: 2 set max; 3 graph min: 4 graph max; 5 set average
- dropline0,1
drop line to baseline
- class jscatter.graceplot.Label(string=None, layout=None, place=None, charsize=None, font=None, color=None, axis=None, location=None)[source]
Bases:
objectUsed for labels of the x-axis and y-axis
- class jscatter.graceplot.Bar(axis=None, onoff=True, color=None, linestyle=None, linewidth=None)[source]
Bases:
objectthis class controls the x and y bars in the frame apparently usually it is off onoff is ‘on’ or ‘off’ the rest are like everything else
- class jscatter.graceplot.Tick(axis=None, onoff=True, major=None, minorticks=None, inout=None, majorsize=None, majorcolor=None, majorlinewidth=None, majorlinestyle=None, majorgrid=None, minorcolor=None, minorlinewidth=None, minorlinestyle=None, minorgrid=None, minorsize=None, placeon=None, type=None, default=None, TickLabel=None)[source]
Bases:
objectControls appearence of ticks on an axis.
- Parameters:
- onoff
is either ‘on’ or ‘off’
- major
is the space between ticks?
- minorticks
is the number of minorticks between major ticks?
- inout
determines if they point ‘in’ or ‘out’ or ‘both’
- majorsize
determines how long the major ticks are
- majorlinewidth
is how thick the major ticks are
- majorlinestyle
is controls the linestle of the ticks and major gridlines
- majorgrid
turns the major grid lines ‘on’ or ‘off’
- minorcolor
is the color of the minor tick lines
- minorlinewidth
- minorlinestyle
controls the linestle of the ticks and minor gridlines
- minorgrid
turns the minor gridlines on
- minorsize
is the lengthe of the minor gridlines
- placeon
is it is usually set to ‘both’,’normal’,’opposite’
- type
is ? it is usually set to ‘auto’
- default
is ? a number
- class jscatter.graceplot.TickLabel(axis=None, onoff=True, type=None, prec=None, format=None, append=None, prepend=None, angle=None, placeon=None, skip=None, stagger=None, op=None, sign=None, starttype=None, start=None, stoptype=None, stop=None, charsize=None, font=None, color=None)[source]
Bases:
objectTicklabels
- Parameters:
- onoff‘on’,’off’
- type ‘auto’
- prec
- format :string ,’general’ is default
decimal,exponential,general,power,scientific
- appendstring
added to the end of the label
- prependstring
added to the beginning of the label
- anglefloat
degrees? of rotation
- placeon‘normal’,’both’,’opposite’
where to place labels
- skipint which skips some labels somehow
- staggeris an integer that staggers the labels somehow
- op‘bottom’ for x-axis, ‘left’ for y-axis
- sign‘normal’
- starttypestring ‘auto’
- startfloat don;t know what it does
- stoptypestring ‘auto’
- stopfloat purpose?
- charsizefloat for character size
- fontinteger for the font
- colorinteger for the color
- Returns:
- TickLabel object
- class jscatter.graceplot.Annotation(onoff=True, type=None, charsize=None, font=None, color=None, rot=None, format=None, prec=None, prepend=None, append=None, offset=None)[source]
Bases:
objectcontrols annotation
- Parameters:
- onoff‘on’ or ‘off’
- typeint
- charsizefloat
- fontint
- colorint
- rotfloat
- formatint
- precint
- prependint
- appendint
- offsetint
- class jscatter.graceplot.Errorbar(onoff=True, place=None, color=None, pattern=None, size=None, linewidth=None, linestyle=None, riserlinewidth=None, riserlinestyle=None, riserclip=None, risercliplength=None)[source]
Bases:
objectclass for errorbars
- Parameters:
- onoffTrue False,’on’,’off’, default on
turns the error bars on or off
- place‘normal’, ‘opposite’, ‘both’ default ‘both’
- colorint
color integer
- patternint
- linewidthfloat
- linestyleint
- riserlinewidthfloat
risers are the lines from the symbol to the end
- riserlinestyleint
- riserclip‘on’,’off’
set to on or off, determines if an arrow is drawn for error bars offscale
- risercliplengthfloat