2. dataArray
dataArray contain a single matrix like dataset with attributes.
matrix like data with columns and rows
attributes are linked to the data e.g. from a measurement/simulation/fit parameters.
all numpy array functionality preserved as e.g. slicing, index tricks.
fit routine from scipy.optimize (least_square, differential-evolution, minimize, …)
read/write in human readable ASCII text including attributes (optional zipped).
For programmers: a ndarray subclass
dataArray creation can be from read ASCII files or ndarrays as data=js.dA(‘filename.dat’).
See dataArray for details.
Hint for Beginners:
The dataArray methods should not be used directly from this module.
Instead create a dataArray and use the methods from this object as in the examples.
Example Read data and plot (see Reading ASCII files for more about reading data)
import jscatter as js
i5=js.dA(js.examples.datapath+'/iqt_1hho.dat',index=5)  # read 5th data from file with multiple data
i5=js.dL(js.examples.datapath+'/iqt_1hho.dat')[5]       # same as above (but read as dataList, then select 5th)
p=js.grace()
p.plot(i5)
Example create/change/…
import jscatter as js
import numpy as np
x=np.r_[0:10:0.5]                                        # a list of values
D,A,q=0.45,0.99,1.2

# create dataArray from numpy array
data0 =js.dA(np.c_[x, x**2, A*np.sin(x)].T)
data=js.dA(np.vstack([x,np.exp(-q**2*D*x),np.random.rand(len(x))*0.05]))

data.D=D;data.A=A;data.q=q
data.Y=data.Y*data.A                                     # change Y values
data[2]*=2                                               # change 3rd column
data.reason='just as a test'                             # add comment
data.Temperature=273.15+20                               # add attribut
data.savetxt('justasexample.dat')                        # save data
data2=js.dA('justasexample.dat')                         # read data into dataArray
data2.Y=data2.Y/data2.A
# use a method (from fitting or housekeeping)
data2.interp(np.r_[1:2:0.01]) # for interpolation
Example fit
import jscatter as js
import numpy as np

data=js.dA(js.examples.datapath+'/exampledata0.dat') # load data into a dataArray
def parabola(q,a,b,c):
   y = (q-a)**2+b*q+c
   return y
data.fit( model=parabola ,freepar={'a':2,'b':4}, fixpar={'c':-20}, mapNames={'q':'X'})
data.showlastErrPlot()
The dataarray module can be run standalone in a new project.
2.1. dataArray Class
|
dataArray (ndarray subclass) with attributes for fitting, plotting, filter. |
dataArray creating by data=js.dA(‘filename.dat’) or from numpy arrays.
Array columns can be accessed as automatic generated attributes like .X,.Y,.eY (see protectedNames). or by indexing as
data[0]Corresponding column indices are set by
setColumnIndex()(default X,Y,eY = 0,1,2).Multidimensional fitting of 1D,2D,3D (.X,.Z,.W) data. .Y are used as function values at coordinates [.X,.Z,.W] in fitting.
Attributes can be set like: data.aName= 1.2345
Methods are used as data.methodname(arguments)
2.2. Attribute Methods
Defined protected names which are not allowed as attribute names. |
|
Show attributes with values as overview. |
Return data specific attributes as sorted list. |
|
|
Extract a non number parameter from comment with attrname in front |
|
Extracts not obvious attributes from comment and adds them to attributes. |
|
Resume attributes in text form. |
|
Set (copy) attributes from objekt. |
|
Set the column index where to find X,Y,Z,W, eY, eX, eZ |
Return defined column indices. |
|
name, mainly the filename of read data files. |
|
Strip attributes and return a simple ndarray. |
|
|
Return indices of the maximum values along the given axis. |
|
Return indices of the minimum values along the given axis. |
2.3. Fit Methods
Least square fit and Bayes
|
Least square fit to model that minimizes \(\chi^2\) (uses scipy.optimize). |
|
Calculates modelValues after a fit allowing simulation with changed parameters. |
|
Estimate error |
|
Refined fit with starting values from previous fit. |
|
Returns Bayes sampler after Bayesian fit. |
|
Set upper and lower limits for parameters in the least square fit. |
Return existing limits. |
|
|
Set constrains for constrained minimization in fit. |
Return list with defined constrained source code. |
|
|
Creates a GracePlot for intermediate output from fit with residuals. |
|
Creates a NEW ErrPlot without destroying the last. |
|
Kills ErrPlot |
|
Detaches ErrPlot without killing it and returns a reference to it. |
|
Shows last ErrPlot as created by makeErrPlot with last fit result. |
|
Saves errplot to file with filename. |
|
Simulate model results (showing errPlot but without fitting). |
Prediction
|
Inter(extra)polated values for column using a polyfit. |
|
Piecewise spline interpolated values for a column. |
|
Piecewise linear interpolated values of all columns. |
|
Piecewise linear interpolated values for a column (faster). |
2.4. Housekeeping Methods
|
Saves dataArray in ASCII text file (optional gzipped). |
|
Sort along a column !!in place |
|
Copy with lines where condition is fulfilled. |
|
Reduce number of values between upper and lower limits by selection or averaging in intervals. |
|
Merges dataArrays to self !!NOT in place!! |
|
Concatenates the dataArray[s] others to self !NOT IN PLACE! |
|
Copy with n new zero columns at the end !!NOT in place!! |
|
Copy with new columns at the end populated by values !!NOT in place!! |
Deepcopy without attributes, thus only the data. |
|
|
Regrid multidimensional data to a regular grid with optional interpolation of .Y values for missing points. |
2.5. Convenience
|
dataArray filled with zeros. |
|
dataArray filled with ones. |
|
Evaluation of Y=function(X) for all X and returns a dataArray with X,Y |
- jscatter.dataarray.protectedNames = ['X', 'Y', 'eY', 'eX', 'Z', 'eZ', 'W', 'eW']
Defined protected names which are not allowed as attribute names.
- class jscatter.dataarray.dataArray(input=None, dtype=None, filename=None, block=None, index=0, usecols=None, skiplines=None, replace=None, ignore='#', delimiter=None, takeline=None, lines2parameter=None, XYeYeX=None, encoding=None)[source]
Bases:
dataArrayBasedataArray (ndarray subclass) with attributes for fitting, plotting, filter.
A subclass of numpy ndarrays with attributes to add parameters describing the data.
Allows fitting, plotting, filtering, prune and more.
.X, .Y, .eY link to specified columns.
Numpy array functionality is preserved.
dataArray creation parameters (below) mainly determine how a file is read from file.
.Y are used as function values at coordinates [.X,.Z,.W] in fitting.
- Parameters:
- inputstring, ndarray
- Object to create a dataArray from.
Filenames with extension ‘.gz’ are decompressed (gzip).
filenames with asterisk like exda=dataList(objekt=’aa12*’) as input for multiple files.
An in-memory stream for text I/O (io.StringIO).
- dtypedata type
dtype of final dataArray, see numpy.ndarray
- indexint, default 0
Index of the dataset in the given input to select one from multiple.
- blockstring,slice (or slice indices), default None
Indicates separation of dataArray in file if multiple are present.
None : Auto detection of blocks according to change between datalines and non-datalines. A new dataArray is created if data and attributes are present.
string : If block is found at beginning of line a new dataArray is created and appended. block can be something like “next” or the first parameter name of a new block as block=’Temp’
slice or slice indices : block=slice(2,100,3) slices the filelines in file as lines[i:j:k] . If only indices are given these are converted to slice.
- XYeYeXlist integers, default=[0,1,2,None,None,None]
Columns for X, Y, eY, eX, Z, eZ, W, eW. Change later with e.g. setColumnIndex(3,5,32). Values in dataArray can be changed by dataArray.X=[list of length X ].
- usecolslist of integer
Use only given columns and ignore others (after skiplines).
- ignorestring, default ‘#’
Ignore lines starting with string e.g. ‘#’. For more complex lines to ignore use skiplines.
- replacedictionary of [string,regular expression object]:string
String replacement in each read line as {‘old’:’new’,…} (done after takeline).
This is done prior to determining line type and can be used to convert strings to number or remove bad characters {‘,’:’.’}.
If dict key is a regular expression object (e.g. rH=re.compile(‘Hd+’) ),it is replaced by string. See Python module re for syntax.
- skiplinesfunction returning bool, list of string or single string
Skip if line meets condition. Function gets the list of words in a data line. Examples
# words with exact match
skiplines = lambda w: any(wi in w for wi in ['',' ','NAN',''*****])
skiplines = lambda w: any(float(wi)>3.1411 for wi in w)
skiplines = lambda w: len(w)==1
# skip explicitly empty lines
skiplines = lambda w: len(w)==0
If a list is given, the lambda function is generated automatically as in above example. If single string is given, it is tested if string is a substring of a word ( ‘abc’ in ‘123abc456’)
- delimiterstring
Separator between data fields in a line, default any whitespace. E.g. r’t’ tabulator
- takelinestring,list of string, function
Filter lines to be included (all lines) e.g. to select line starting with ‘ATOM’. Should be combined with: replace (replace starting word by number {‘ATOM’:1} to be detected as data) and usecols to select the needed columns. Examples (function gets words in line):
lambda words: any(w in words for w in [‘ATOM’,’CA’]) # one of both words somewhere in line
lambda w: (w[0]==’ATOM’) & (w[2]==’CA’) # starts with ‘ATOM’ and third is ‘CA’
For word or list of words first example is generated automatically.
- lines2parameterlist of integer
List of line numbers to use as attribute with attribute name ‘line_i’.
>0 positive numbers mark lines at beginnig of a file.
<0 negative numbers mark lines at beginning of a block (see block).
dont mix ! (then only >0 are used)
Used to mark lines containing parameters without name (only numbers in a line as in .pdh files in the header). E.g. to skip the first lines of a file or block.
- XYeYeXlist integers, default=[0,1,2,None,None,None]
Sets columns for X, Y, eY, eX, Z, eZ, W, eW. This is ignored for dataList and dataArray objects as these have defined columns. Change later by: data.setColumnIndex .
- encodingNone, ‘utf-8’, ‘cp1252’, ‘ascii’
The encoding of the files read. By default the system default encoding is used. Others python2.7=’ascii’, python3=’utf-8’, Windows_english=’cp1252’, Windows_german=’cp1251’
- Returns:
- dataArray
Notes
The concept is to have tabulated data like a table with additional attributes related to the data. Special attributes like .X, .Y and .eY for values and error are used for manipulating the table content (additional to direct indexing).
Read/create/write
import jscatter as js
# read from file
daa=js.dA('./exampleData/iqt_1hho.dat',index=2)

# create from numpy array
x = np.r_[1:100]
da1 = js.dA(np.c_[x, x**2, np.random.randn(*x.shape)].T)
da2 = js.dA(np.c_[[1,2,3], [4,5,6], [7,8,9]].T)
dbb = js.ones((4,12))

# add attributes
dbb.ones = 11111

# save
dbb.save('folder/ones.dat')
dbb.save('folder/ones.dat.gz')  # gziped file
Attributes to avoid (they are in the name space of numpy ndarrays): T,mean,max,min,… These names are substitute by appended ‘_’ (underscore) if found in read data. Get a complete list by “dir(np.array(0))”.
Avoid attribute names including special math characters as “ ** + - / & “. Any char that can be interpreted as a function (e.g. datalist.up-down) will be interpreted from python as : updown=datalist.up operator(minus) down and result in: AttributeError. To get the values use getattr(dataList,’up-down’) or avoid usage of these characters.
If an attribute ‘columnname’ exists with a string containing columnnames separated by semicolon the corresponding columns can be accessed in 2 ways ( columnname=’wavevector; Iqt’ ):
attribute with prepended underscore ‘_’+’name’ => data._Iqt
columnname string used as index => data[‘Iqt’]
From the names all char like “+-*/()[]()|§$%&#><°^, “ are deleted.
The columnname string is saved with the data and is restored when rereading the data.
This is intended for reading and not writing.
Data access/change
exa = js.dA('afile.dat')          # read data
exa.columnname = 't; iqt; e+iqt'  # give names to columns
exa.eY = exa.Y*0.05               # default for X, Y is column 0,1; see XYeYeX or .setColumnIndex ; read+write

exa[-1] = exa[1]**4               # direct indexing of columns; read+write
exa[-1,::2] = exa[1,::2]*4        # direct indexing of columns; read+write; each second is used (see numpy)

eq1 = exa[2]*exa[0]*4             # read+write
iq2 = exa._iqt*4                  # access by underscore name; only read
eq3 = exa._eiqt*exa._t*4          # read
iq4 = exa['iqt']*4                # access like dictionary; only read
eq5 = exa['eiqt']*exa['t']*4      # read

aa = np.r_[[np.r_[1:100],np.r_[1:100]**2]] # load from numpy array
daa = js.dA(aa)                            # with shape
daa.Y = daa.Y*2                            # change Y values; same as daa[1]
dbb = js.zeros((4,12))                     # empty dataArray
dbb.X = np.r_[1:13]                        # set X
dbb.Y = np.r_[1:13]**0.5                   # set Y
dbb[2] = dbb.X*5
dbb[3] = 0.5                               # set 4th column
dbb.a = 0.2345
dbb.setColumnIndex(ix=2,iy=1,iey=None)   # change column index for X,Y, end no eY
Selecting
ndbb = dbb[:,dbb.X>20]            # only X>20
ndbb = dbb[:,dbb.X>dbb.Y/dbb.a]   # only X>Y/a
Rules for reading of ASCII files
How files are interpreted :
Reads simple formats as tables with rows and columns like numpy.loadtxt.The difference is how to treat additional information like attributes or comments and non float data.Line format rules: A dataset consists of comments, attributes and data (and optional other datasets).
First two words in a line decide what it is:
string + value -> attribute with attribute name and list of values
string + string -> comment ignore or convert to attribute by getfromcomment
value + value -> data line of an array; in sequence without break, input for the ndarray
single words -> are appended to comment
string+@unique_name-> link to other dataArray with unique_name
Even complex ASCII file can be read with a few changes as options.
Datasets are given as blocks of attributes and data.
A new dataArray is created if:
a data block with a parameter block (preceded or appended) is found.
a keyword as first word in line is found: - Keyword can be e.g. the name of the first parameter. - Blocks are separated as start or end of a data block (like a matrix). - It is checked if parameters are prepended or append to the datablock. - If both is used, set block to the first keyword in first line of new block (name of the first parameter).
Example of an ASCII file with attributes temp, pressure, name:
this is just a comment or description of the data
temp     293
pressure 1013 14
name     temp1bsa
XYeYeX 0 1 2
0.854979E-01  0.178301E+03  0.383044E+02
0.882382E-01  0.156139E+03  0.135279E+02
0.909785E-01  0.150313E+03  0.110681E+02
0.937188E-01  0.147430E+03  0.954762E+01
0.964591E-01  0.141615E+03  0.846613E+01
0.991995E-01  0.141024E+03  0.750891E+01
0.101940E+00  0.135792E+03  0.685011E+01
0.104680E+00  0.140996E+03  0.607993E+01

this is just a second comment
temp     393
pressure 1011 12
name     temp2bsa
XYeYeX 0 1 2
0.236215E+00  0.107017E+03  0.741353E+00
0.238955E+00  0.104532E+03  0.749095E+00
0.241696E+00  0.104861E+03  0.730935E+00
0.244436E+00  0.104052E+03  0.725260E+00
0.247176E+00  0.103076E+03  0.728606E+00
0.249916E+00  0.101828E+03  0.694907E+00
0.252657E+00  0.102275E+03  0.712851E+00
0.255397E+00  0.102052E+03  0.702520E+00
0.258137E+00  0.100898E+03  0.690019E+00
optional:
string + @name: Link to other data in same file with name given as “name”. Content of @name is used as identifier. Think of an attribute with 2dim data.
Attribute xyeyx defines column index for [‘X’, ‘Y’, ‘eY’, ‘eX’, ‘Z’, ‘eZ’, ‘W’, ‘eW’]. Noninteger evaluates to None. If not given default is ‘0 1 2’ Line looks like
XYeYeX 0 2 3 - 1 - - -
Reading of complex files with filtering of specific information To read something like a pdb structure file with lines like
...
ATOM      1  N   LYS A   1       3.246  10.041  10.379  1.00  5.28           N
ATOM      2  CA  LYS A   1       2.386  10.407   9.247  1.00  7.90           C
ATOM      3  C   LYS A   1       2.462  11.927   9.098  1.00  7.93           C
ATOM      4  O   LYS A   1       2.582  12.668  10.097  1.00  6.28           O
ATOM      5  CB  LYS A   1       0.946   9.964   9.482  1.00  3.54           C
ATOM      6  CG  LYS A   1      -0.045  10.455   8.444  1.00  3.75           C
ATOM      7  CD  LYS A   1      -1.470  10.062   8.818  1.00  2.85           C
ATOM      8  CE  LYS A   1      -2.354   9.922   7.589  1.00  3.83           C
ATOM      9  NZ  LYS A   1      -3.681   9.377   7.952  1.00  1.78           N
...
combine takeline, replace and usecols.
usecols=[6,7,8] selects the columns as x,y,z positions
# select all atoms
xyz = js.dA('3rn3.pdb',takeline=lambda w:w[0]=='ATOM',replace={'ATOM':1},usecols=[6,7,8])
# select only CA atoms
xyz = js.dA('3rn3.pdb',takeline=lambda w:(w[0]=='ATOM') & (w[2]=='CA'),replace={'ATOM':1},usecols=[6,7,8])
# in PDB files different atomic structures are separate my "MODEL","ENDMODEL" lines.
# We might load all by using block
xyz = js.dA('3rn3.pdb',takeline=lambda w:(w[0]=='ATOM') & (w[2]=='CA'),
                       replace={'ATOM':1},usecols=[6,7,8],block='MODEL')
- makeErrPlot(*args, **kwargs)[source]
Creates a GracePlot for intermediate output from fit with residuals.
ErrPlot is updated only if consecutive steps need more than 2 seconds. The plot can be accessed later as
.errplot.- Parameters:
- titlestring
Title of plot.
- residualsstring
Plot type of residuals (=y-f(x,…)).
‘absolut’ or ‘a’ absolute residuals
‘relative’ or ‘r’ relative =residuals/y
‘x2’ or ‘x’ residuals/eY with chi2 =sum((residuals/eY)**2)
- showfixparboolean default: True
Show the fixed parameters in errplot.
- yscale,xscale‘n’,’l’ for ‘normal’, ‘logarithmic’
Y scale, log or normal (linear)
- fitlinecolorint, [int,int,int]
Color for fit lines (or line style as in plot). If not given same color as data.
- legpos‘ll’, ‘ur’, ‘ul’, ‘lr’, [rx,ry]
Legend position shortcut in viewport coordinates. Shortcuts for lower left, upper right, upper left, lower right or relative viewport coordinates as [0.2,0.2].
- headlessbool, ‘agr’, ‘png’, ‘jpg’, ‘svg’, ‘pnm’, ‘pdf’
Use errPlot in headless mode (NO-Gui). True saves to lastErrPlot.agr with regular updates (all 2 seconds). A file type changes to specified file type as printed.
- size[float, float]
Plot size in inch.
Examples
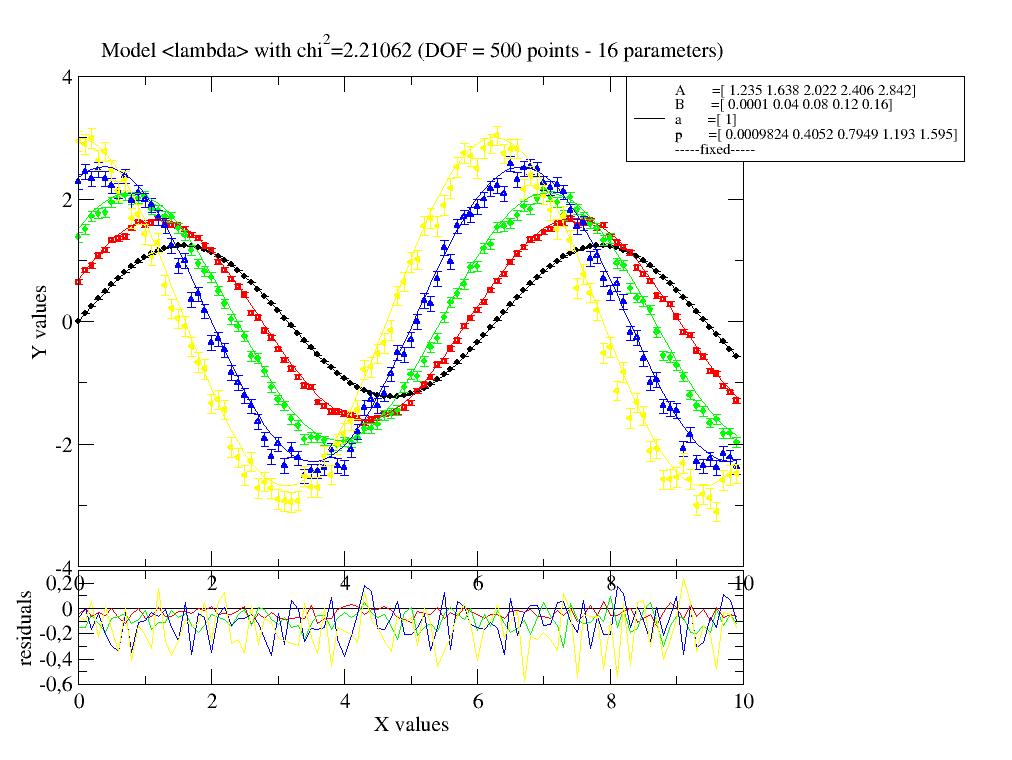
ErrPlot with fitted data (points), model function (lines) and the difference between both in an additional plot to highlight differences.
- property errplot
Errplot handle
- makeNewErrPlot(*args, **kwargs)[source]
Creates a NEW ErrPlot without destroying the last. See makeErrPlot for details.
- Parameters:
- **kwargs
Keyword arguments passed to makeErrPlot.
- detachErrPlot(*args, **kwargs)[source]
Detaches ErrPlot without killing it and returns a reference to it.
- showlastErrPlot(*args, **kwargs)[source]
Shows last ErrPlot as created by makeErrPlot with last fit result.
Same arguments as in makeErrPlot.
Additional keyword arguments are passed as in modelValues and simulate changes in the parameters. Without parameters the last fit is retrieved.
- T
View of the transposed array.
Same as
self.transpose().See also
Examples
>>> import numpy as np
>>> a = np.array([[1, 2], [3, 4]])
>>> a
array([[1, 2],
       [3, 4]])
>>> a.T
array([[1, 3],
       [2, 4]])
>>> a = np.array([1, 2, 3, 4])
>>> a
array([1, 2, 3, 4])
>>> a.T
array([1, 2, 3, 4])
- property X
this delivers attributes of dataArray class
- property Y
this delivers attributes of dataArray class
- addColumn(n=1, values=0)
Copy with new columns at the end populated by values !!NOT in place!!
Column indices (where to find .X, ..Y) are converted to positive values to preserve assignment.
- Parameters:
- nint
Number of columns to append
- valuesfloat, list of float
Values to append in columns as data[-n:]=values
Examples
import jscatter as js i5 = js.dL(js.examples.datapath+’/iqt_1hho.dat’)[0] i55 = i5.addColumn(2,i5[1:])
- addZeroColumns(n=1)
Copy with n new zero columns at the end !!NOT in place!!
Column indices are converted to positive values to preserve assignment.
- Parameters:
- nint
Number of columns to append
- all(axis=None, out=None, *, keepdims=<no value>, where=<no value>)
Returns True if all elements evaluate to True.
Refer to numpy.all for full documentation.
See also
numpy.allequivalent function
- any(axis=None, out=None, *, keepdims=<no value>, where=<no value>)
Returns True if any of the elements of a evaluate to True.
Refer to numpy.any for full documentation.
See also
numpy.anyequivalent function
- argmax(axis=None, out=None, *, keepdims=False)
Return indices of the maximum values along the given axis.
Refer to numpy.argmax for full documentation.
See also
numpy.argmaxequivalent function
- argmin(axis=None, out=None, *, keepdims=False)
Return indices of the minimum values along the given axis.
Refer to numpy.argmin for detailed documentation.
See also
numpy.argminequivalent function
- argpartition(kth, axis=-1, kind='introselect', order=None)
Returns the indices that would partition this array.
Refer to numpy.argpartition for full documentation.
See also
numpy.argpartitionequivalent function
- argsort(axis=-1, kind=None, order=None, *, stable=None, descending=None)
Returns the indices that would sort this array.
Refer to numpy.argsort for full documentation.
See also
numpy.argsortequivalent function
- property array
Strip attributes and return a simple ndarray.
- astype(dtype, order='K', casting='unsafe', subok=True, copy=True)
Copy of the array, cast to a specified type.
- Parameters:
- dtypestr or dtype
Typecode or data-type to which the array is cast.
- order{‘C’, ‘F’, ‘A’, ‘K’}, optional
Controls the memory layout order of the result. ‘C’ means C order, ‘F’ means Fortran order, ‘A’ means ‘F’ order if all the arrays are Fortran contiguous, ‘C’ order otherwise, and ‘K’ means as close to the order the array elements appear in memory as possible. Default is ‘K’.
- casting{‘no’, ‘equiv’, ‘safe’, ‘same_kind’, ‘same_value’, ‘unsafe’}, optional
Controls what kind of data casting may occur. Defaults to ‘unsafe’ for backwards compatibility.
‘no’ means the data types should not be cast at all.
‘equiv’ means only byte-order changes are allowed.
‘safe’ means only casts which can preserve values are allowed.
‘same_kind’ means only safe casts or casts within a kind, like float64 to float32, are allowed.
‘unsafe’ means any data conversions may be done.
‘same_value’ means any data conversions may be done, but the values must not change, including rounding of floats or overflow of ints
Added in version 2.4: Support for
'same_value'was added.- subokbool, optional
If True, then sub-classes will be passed-through (default), otherwise the returned array will be forced to be a base-class array.
- copybool, optional
By default, astype always returns a newly allocated array. If this is set to false, and the dtype, order, and subok requirements are satisfied, the input array is returned instead of a copy.
- Returns:
- arr_tndarray
Unless copy is False and the other conditions for returning the input array are satisfied (see description for copy input parameter), arr_t is a new array of the same shape as the input array, with dtype, order given by dtype, order.
- Raises:
- ComplexWarning
When casting from complex to float or int. To avoid this, one should use
a.real.astype(t).- ValueError
When casting using
'same_value'and the values change or would overflow
Examples
>>> import numpy as np
>>> x = np.array([1, 2, 2.5])
>>> x
array([1. ,  2. ,  2.5])
>>> x.astype(np.int_)
array([1, 2, 2])
>>> x.astype(np.int_, casting="same_value")
Traceback (most recent call last):
...
ValueError: could not cast 'same_value' double to long
>>> x[:2].astype(np.int_, casting="same_value")
array([1, 2])
- property attr
Return data specific attributes as sorted list.
- Returns:
- liststring
- base
Base object if memory is from some other object.
Examples
The base of an array that owns its memory is None:
>>> import numpy as np
>>> x = np.array([1,2,3,4])
>>> x.base is None
True
Slicing creates a view, whose memory is shared with x:
>>> y = x[2:]
>>> y.base is x
True
- byteswap(inplace=False)
Swap the bytes of the array elements
Toggle between low-endian and big-endian data representation by returning a byteswapped array, optionally swapped in-place. Arrays of byte-strings are not swapped. The real and imaginary parts of a complex number are swapped individually.
- Parameters:
- inplacebool, optional
If
True, swap bytes in-place, default isFalse.
- Returns:
- outndarray
The byteswapped array. If inplace is
True, this is a view to self.
Examples
>>> import numpy as np
>>> A = np.array([1, 256, 8755], dtype=np.int16)
>>> list(map(hex, A))
['0x1', '0x100', '0x2233']
>>> A.byteswap(inplace=True)
array([  256,     1, 13090], dtype=int16)
>>> list(map(hex, A))
['0x100', '0x1', '0x3322']
Arrays of byte-strings are not swapped
>>> A = np.array([b'ceg', b'fac'])
>>> A.byteswap()
array([b'ceg', b'fac'], dtype='|S3')
A.view(A.dtype.newbyteorder()).byteswap()produces an array with the same values but different representation in memory>>> A = np.array([1, 2, 3],dtype=np.int64) >>> A.view(np.uint8) array([1, 0, 0, 0, 0, 0, 0, 0, 2, 0, 0, 0, 0, 0, 0, 0, 3, 0, 0, 0, 0, 0, 0, 0], dtype=uint8) >>> A.view(A.dtype.newbyteorder()).byteswap(inplace=True) array([1, 2, 3], dtype='>i8') >>> A.view(np.uint8) array([0, 0, 0, 0, 0, 0, 0, 1, 0, 0, 0, 0, 0, 0, 0, 2, 0, 0, 0, 0, 0, 0, 0, 3], dtype=uint8)
- choose(choices, out=None, mode='raise')
Use an index array to construct a new array from a set of choices.
Refer to numpy.choose for full documentation.
See also
numpy.chooseequivalent function
- clip(min=<no value>, max=<no value>, out=None, **kwargs)
Return an array whose values are limited to
[min, max]. One of max or min must be given.Refer to numpy.clip for full documentation.
See also
numpy.clipequivalent function
- property columnIndex
Return defined column indices.
- compress(condition, axis=None, out=None)
Return selected slices of this array along given axis.
Refer to numpy.compress for full documentation.
See also
numpy.compressequivalent function
- concatenate(others, axis=1, isort=None, missing=None)
Concatenates the dataArray[s] others to self !NOT IN PLACE!
and add attributes from others according to parameter
missing.- Parameters:
- othersdataArray, dataList, list of dataArray
Objects to concatenate with same shape as self.
- axisinteger, None
Axis along to concatenate. Default concatenates along X. None flattens the dataArray before merge. See numpy.concatenate.
- isortinteger
Sort array along column isort =i
- missingNone, ‘error’, ‘drop’, ‘skip’. ‘first’, default=None
- Determines how to deal with missing attributes.
Insert none
Raise AttributeError
‘drop’ attribute value for missing
‘skip’ attribute for all
Use ‘first’ one
- Returns:
- dataArray with merged attributes and isorted
Notes
See numpy.concatenate
- conj()
Complex-conjugate all elements.
Refer to numpy.conjugate for full documentation.
See also
numpy.conjugateequivalent function
- conjugate()
Return the complex conjugate, element-wise.
Refer to numpy.conjugate for full documentation.
See also
numpy.conjugateequivalent function
- copy()
Deepcopy of dataArray
To make a normal shallow copy use copy.copy
- ctypes
An object to simplify the interaction of the array with the ctypes module.
This attribute creates an object that makes it easier to use arrays when calling shared libraries with the ctypes module. The returned object has, among others, data, shape, and strides attributes (see Notes below) which themselves return ctypes objects that can be used as arguments to a shared library.
- Parameters:
- None
- Returns:
- cPython object
Possessing attributes data, shape, strides, etc.
See also
numpy.ctypeslib
Notes
Below are the public attributes of this object which were documented in “Guide to NumPy” (we have omitted undocumented public attributes, as well as documented private attributes):
- _ctypes.data
A pointer to the memory area of the array as a Python integer. This memory area may contain data that is not aligned, or not in correct byte-order. The memory area may not even be writeable. The array flags and data-type of this array should be respected when passing this attribute to arbitrary C-code to avoid trouble that can include Python crashing. User Beware! The value of this attribute is exactly the same as:
self._array_interface_['data'][0].Note that unlike
data_as, a reference won’t be kept to the array: code likectypes.c_void_p((a + b).ctypes.data)will result in a pointer to a deallocated array, and should be spelt(a + b).ctypes.data_as(ctypes.c_void_p)
- _ctypes.shape
(c_intp*self.ndim): A ctypes array of length self.ndim where the basetype is the C-integer corresponding to
dtype('p')on this platform (see ~numpy.ctypeslib.c_intp). This base-type could be ctypes.c_int, ctypes.c_long, or ctypes.c_longlong depending on the platform. The ctypes array contains the shape of the underlying array.
- _ctypes.strides
(c_intp*self.ndim): A ctypes array of length self.ndim where the basetype is the same as for the shape attribute. This ctypes array contains the strides information from the underlying array. This strides information is important for showing how many bytes must be jumped to get to the next element in the array.
- _ctypes.data_as(obj)
Return the data pointer cast to a particular c-types object. For example, calling
self._as_parameter_is equivalent toself.data_as(ctypes.c_void_p). Perhaps you want to use the data as a pointer to a ctypes array of floating-point data:self.data_as(ctypes.POINTER(ctypes.c_double)).The returned pointer will keep a reference to the array.
- _ctypes.shape_as(obj)
Return the shape tuple as an array of some other c-types type. For example:
self.shape_as(ctypes.c_short).
- _ctypes.strides_as(obj)
Return the strides tuple as an array of some other c-types type. For example:
self.strides_as(ctypes.c_longlong).
If the ctypes module is not available, then the ctypes attribute of array objects still returns something useful, but ctypes objects are not returned and errors may be raised instead. In particular, the object will still have the
as_parameterattribute which will return an integer equal to the data attribute.Examples
>>> import numpy as np
>>> import ctypes
>>> x = np.array([[0, 1], [2, 3]], dtype=np.int32)
>>> x
array([[0, 1],
       [2, 3]], dtype=int32)
>>> x.ctypes.data
31962608 # may vary
>>> x.ctypes.data_as(ctypes.POINTER(ctypes.c_uint32))
<__main__.LP_c_uint object at 0x7ff2fc1fc200> # may vary
>>> x.ctypes.data_as(ctypes.POINTER(ctypes.c_uint32)).contents
c_uint(0)
>>> x.ctypes.data_as(ctypes.POINTER(ctypes.c_uint64)).contents
c_ulong(4294967296)
>>> x.ctypes.shape
<numpy._core._internal.c_long_Array_2 object at 0x7ff2fc1fce60> # may vary
>>> x.ctypes.strides
<numpy._core._internal.c_long_Array_2 object at 0x7ff2fc1ff320> # may vary
- cumprod(axis=None, dtype=None, out=None)
Return the cumulative product of the elements along the given axis.
Refer to numpy.cumprod for full documentation.
See also
numpy.cumprodequivalent function
- cumsum(axis=None, dtype=None, out=None)
Return the cumulative sum of the elements along the given axis.
Refer to numpy.cumsum for full documentation.
See also
numpy.cumsumequivalent function
- data
Python buffer object pointing to the start of the array’s data.
- device
- diagonal(offset=0, axis1=0, axis2=1)
Return specified diagonals. In NumPy 1.9 the returned array is a read-only view instead of a copy as in previous NumPy versions. In a future version the read-only restriction will be removed.
Refer to
numpy.diagonal()for full documentation.See also
numpy.diagonalequivalent function
- dot(other, /, out=None)
Refer to
numpy.dot()for full documentation.See also
numpy.dotequivalent function
- dtype
Data-type of the array’s elements.
Warning
Setting
arr.dtypeis discouraged and may be deprecated in the future. Setting will replace thedtypewithout modifying the memory (see also ndarray.view and ndarray.astype).- Parameters:
- None
- Returns:
- dnumpy dtype object
See also
ndarray.astypeCast the values contained in the array to a new data-type.
ndarray.viewCreate a view of the same data but a different data-type.
numpy.dtype
Examples
>>> import numpy as np
>>> x = np.arange(4).reshape((2, 2))
>>> x
array([[0, 1],
       [2, 3]])
>>> x.dtype
dtype('int64')   # may vary (OS, bitness)
>>> isinstance(x.dtype, np.dtype)
True
- dump(file)
Dump a pickle of the array to the specified file. The array can be read back with pickle.load or numpy.load.
- Parameters:
- filestr or Path
A string naming the dump file.
- dumps()
Returns the pickle of the array as a string.
pickle.loadswill convert the string back to an array.- Parameters:
- None
- property eY
this delivers attributes of dataArray class
- errPlottitle(*args, **kwargs)
- estimateError(output=True)
Estimate error
Examples
import jscatter as js
import numpy as np
data=js.dA(js.examples.datapath+'/iqt_1hho.dat',index=3)
diffusion=lambda t,wavevector,A,D,b:A*np.exp(-wavevector**2*D*t)+b
data.fit(diffusion ,{'D':0.1,'A':1},{'b':0.},{'t':'X','wavevector':'q'},method='Powell')

data.estimateError()
- extract_comm(iname=0, deletechars='', replace={})
Extracts not obvious attributes from comment and adds them to attributes.
The iname_th word is selected as attribute and all numbers are taken.
- Parameters:
- deletecharsstring
Chars to delete
- replacedictionary of strings
Strings to replace {‘,’:’.’,’as’:’xx’,’r’:’3.14’,…}
- inameinteger
Which string to use as attr name; in example 3 for ‘wavelength’
Notes
example : w [nm] 632 +- 2,5 wavelength extract_comm(iname=3,replace={‘,’:’.’}) result .wavelength=[632, 2.5]
- fill(value)
Fill the array with a scalar value.
- Parameters:
- valuescalar
All elements of a will be assigned this value.
Examples
>>> import numpy as np
>>> a = np.array([1, 2])
>>> a.fill(0)
>>> a
array([0, 0])
>>> a = np.empty(2)
>>> a.fill(1)
>>> a
array([1.,  1.])
Fill expects a scalar value and always behaves the same as assigning to a single array element. The following is a rare example where this distinction is important:
>>> a = np.array([None, None], dtype=np.object_)
>>> a[0] = np.array(3)
>>> a
array([array(3), None], dtype=object)
>>> a.fill(np.array(3))
>>> a
array([array(3), array(3)], dtype=object)
Where other forms of assignments will unpack the array being assigned:
>>> a[...] = np.array(3)
>>> a
array([3, 3], dtype=object)
- fit(model, freepar={}, fixpar={}, mapNames={}, xslice=slice(None, None, None), condition=None, output=True, **kw)
Least square fit to model that minimizes \(\chi^2\) (uses scipy.optimize).
See
dataList.fit(), but only first parameter is used if more than one given.
- flags
Information about the memory layout of the array.
- Attributes:
- C_CONTIGUOUS (C)
The data is in a single, C-style contiguous segment.
- F_CONTIGUOUS (F)
The data is in a single, Fortran-style contiguous segment.
- OWNDATA (O)
The array owns the memory it uses or borrows it from another object.
- WRITEABLE (W)
The data area can be written to. Setting this to False locks the data, making it read-only. A view (slice, etc.) inherits WRITEABLE from its base array at creation time, but a view of a writeable array may be subsequently locked while the base array remains writeable. (The opposite is not true, in that a view of a locked array may not be made writeable. However, currently, locking a base object does not lock any views that already reference it, so under that circumstance it is possible to alter the contents of a locked array via a previously created writeable view onto it.) Attempting to change a non-writeable array raises a RuntimeError exception.
- ALIGNED (A)
The data and all elements are aligned appropriately for the hardware.
- WRITEBACKIFCOPY (X)
This array is a copy of some other array. The C-API function PyArray_ResolveWritebackIfCopy must be called before deallocating to the base array will be updated with the contents of this array.
- FNC
F_CONTIGUOUS and not C_CONTIGUOUS.
- FORC
F_CONTIGUOUS or C_CONTIGUOUS (one-segment test).
- BEHAVED (B)
ALIGNED and WRITEABLE.
- CARRAY (CA)
BEHAVED and C_CONTIGUOUS.
- FARRAY (FA)
BEHAVED and F_CONTIGUOUS and not C_CONTIGUOUS.
Notes
The flags object can be accessed dictionary-like (as in
a.flags['WRITEABLE']), or by using lowercased attribute names (as ina.flags.writeable). Short flag names are only supported in dictionary access.Only the WRITEBACKIFCOPY, WRITEABLE, and ALIGNED flags can be changed by the user, via direct assignment to the attribute or dictionary entry, or by calling ndarray.setflags.
The array flags cannot be set arbitrarily:
WRITEBACKIFCOPY can only be set
False.ALIGNED can only be set
Trueif the data is truly aligned.WRITEABLE can only be set
Trueif the array owns its own memory or the ultimate owner of the memory exposes a writeable buffer interface or is a string.
Arrays can be both C-style and Fortran-style contiguous simultaneously. This is clear for 1-dimensional arrays, but can also be true for higher dimensional arrays.
Even for contiguous arrays a stride for a given dimension
arr.strides[dim]may be arbitrary ifarr.shape[dim] == 1or the array has no elements. It does not generally hold thatself.strides[-1] == self.itemsizefor C-style contiguous arrays orself.strides[0] == self.itemsizefor Fortran-style contiguous arrays is true.
- flat
A 1-D iterator over the array.
This is a numpy.flatiter instance, which acts similarly to, but is not a subclass of, Python’s built-in iterator object.
See also
flattenReturn a copy of the array collapsed into one dimension.
flatiter
Examples
>>> import numpy as np
>>> x = np.arange(1, 7).reshape(2, 3)
>>> x
array([[1, 2, 3],
       [4, 5, 6]])
>>> x.flat[3]
4
>>> x.T
array([[1, 4],
       [2, 5],
       [3, 6]])
>>> x.T.flat[3]
5
>>> type(x.flat)
<class 'numpy.flatiter'>
An assignment example:
>>> x.flat = 3; x
array([[3, 3, 3],
       [3, 3, 3]])
>>> x.flat[[1,4]] = 1; x
array([[3, 1, 3],
       [3, 1, 3]])
- flatten(order='C')
Return a copy of the array collapsed into one dimension.
- Parameters:
- order{‘C’, ‘F’, ‘A’, ‘K’}, optional
‘C’ means to flatten in row-major (C-style) order. ‘F’ means to flatten in column-major (Fortran- style) order. ‘A’ means to flatten in column-major order if a is Fortran contiguous in memory, row-major order otherwise. ‘K’ means to flatten a in the order the elements occur in memory. The default is ‘C’.
- Returns:
- yndarray
A copy of the input array, flattened to one dimension.
Examples
>>> import numpy as np
>>> a = np.array([[1,2], [3,4]])
>>> a.flatten()
array([1, 2, 3, 4])
>>> a.flatten('F')
array([1, 3, 2, 4])
- getBayesSampler(*args, **kwargs)
Returns Bayes sampler after Bayesian fit.
First do a fit with method=’bayes’ then the sampler can be retrieved.
- Returns:
- emcee sampler
Examples
- property getFreepar
- getfield(dtype, offset=0)
Returns a field of the given array as a certain type.
A field is a view of the array data with a given data-type. The values in the view are determined by the given type and the offset into the current array in bytes. The offset needs to be such that the view dtype fits in the array dtype; for example an array of dtype complex128 has 16-byte elements. If taking a view with a 32-bit integer (4 bytes), the offset needs to be between 0 and 12 bytes.
- Parameters:
- dtypestr or dtype
The data type of the view. The dtype size of the view can not be larger than that of the array itself.
- offsetint
Number of bytes to skip before beginning the element view.
Examples
>>> import numpy as np
>>> x = np.diag([1.+1.j]*2)
>>> x[1, 1] = 2 + 4.j
>>> x
array([[1.+1.j,  0.+0.j],
       [0.+0.j,  2.+4.j]])
>>> x.getfield(np.float64)
array([[1.,  0.],
       [0.,  2.]])
By choosing an offset of 8 bytes we can select the complex part of the array for our view:
>>> x.getfield(np.float64, offset=8)
array([[1.,  0.],
       [0.,  4.]])
- getfromcomment(attrname, convert=None, ignorecase=False)
Extract a non number parameter from comment with attrname in front
If multiple names start with parname first one is used. Used comment line is deleted from comments.
- Parameters:
- attrnamestring without spaces
Name of the parameter in first place
- convertfunction
Function to convert the remainder of the line to the desired attribut value. E.g.
# line "Frequency MHz 3.141 "
.getfromcomment('Frequency',convert=lambda a: float(a.split()[1]))
- ignorecasebool
Ignore attrname character case. If True the lowercase attrname is used.
Notes
A more complex example with unit conversion
f={'GHz':1e9,'MHz':1e6,'KHz':1e3,'Hz':1}
# line "Frequency MHz 3.141"
.getfromcomment('Frequency',convert=lambda a: float(a.split()[1]) * f.get(a.split()[0],1))
- property hasConstrain
Return list with defined constrained source code.
- property hasLimit
Return existing limits.
- property has_limit
Return existing limits.
- imag
The imaginary part of the array.
Returns a view into the original array for complex arrays. For non-complex arrays, returns a zero array of the same dtype. For
objectarrays returns elementwise.imagor0if.imagis undefined.Examples
>>> import numpy as np
>>> x = np.sqrt([1+0j, 0+1j])
>>> x.imag
array([ 0.        ,  0.70710678])
>>> x.imag.dtype
dtype('float64')
- interp(X, left=None, right=None, col=None)
Piecewise linear interpolated values for a column (faster).
- Parameters:
- Xarray,float
Values to interpolate
- leftfloat
Value to return for X < X[0], default is col[0].
- rightfloat
Value to return for X > X[-1], defaults is col[-1]
- colstring, int
Which column to interpolate. Default is ‘Y’. Can be index number, columnname or in [‘X’,’Y’,’eY’,…].
- Returns:
- array 1D only interpolated values.
Notes
See numpy.interp. Sorts automatically along X.
- interpAll(X=None, left=None, right=None)
Piecewise linear interpolated values of all columns.
- Parameters:
- Xarray like
New values where to interpolate
- leftfloat
Value to return for X < X[0], default is Y[0].
- rightfloat
Value to return for X > X[-1], defaults is Y[-1].
- Returns:
- dataArray, here with X,Y,Z preserved and all attributes
Notes
See numpy.interp. Sorts automatically along X.
- interpolate(X, left=None, right=None, deg=1, col=None)
Piecewise spline interpolated values for a column.
- Parameters:
- Xarray,float
New values to interpolate in .X.
- leftfloat
Value to return for X < X[0], default is Y[0].
- rightfloat
Value to return for X > X[-1], defaults is Y[-1].
- degstr or int, optional default =1
Specifies the kind of interpolation as a string (‘linear’, ‘nearest’, ‘zero’, ‘slinear’, ‘quadratic’, ‘cubic’, ‘previous’, ‘next’, where ‘zero’, ‘slinear’, ‘quadratic’ and ‘cubic’ refer to a spline interpolation of zeroth, first, second or third order; ‘previous’ and ‘next’ simply return the previous or next value of the point) or as an integer specifying the order of the spline interpolator to use.
scipy.interpolate.interp1d is used with specified fill_value=(left,right) and kind=deg.
- colstring, int
Which column to interpolate. Default is ‘Y’. Can be index number, columnname or in [‘X’,’Y’,’eY’,…].
- Returns:
- dataArray
Notes
See numpy.interp. Sorts automatically along X.
- isort(col='X')
Sort along a column !!in place
- Parameters:
- col‘X’,’Y’,’Z’,’eX’,’eY’,’eZ’ or 0,1,2,…
Column to sort along
- item(*args)
Copy an element of an array to a standard Python scalar and return it.
- Parameters:
- *argsArguments (variable number and type)
none: in this case, the method only works for arrays with one element (a.size == 1), which element is copied into a standard Python scalar object and returned.
int_type: this argument is interpreted as a flat index into the array, specifying which element to copy and return.
tuple of int_types: functions as does a single int_type argument, except that the argument is interpreted as an nd-index into the array.
- Returns:
- zStandard Python scalar object
A copy of the specified element of the array as a suitable Python scalar
Notes
When the data type of a is longdouble or clongdouble, item() returns a scalar array object because there is no available Python scalar that would not lose information. Void arrays return a buffer object for item(), unless fields are defined, in which case a tuple is returned.
item is very similar to a[args], except, instead of an array scalar, a standard Python scalar is returned. This can be useful for speeding up access to elements of the array and doing arithmetic on elements of the array using Python’s optimized math.
Examples
>>> import numpy as np
>>> np.random.seed(123)
>>> x = np.random.randint(9, size=(3, 3))
>>> x
array([[2, 2, 6],
       [1, 3, 6],
       [1, 0, 1]])
>>> x.item(3)
1
>>> x.item(7)
0
>>> x.item((0, 1))
2
>>> x.item((2, 2))
1
For an array with object dtype, elements are returned as-is.
>>> a = np.array([np.int64(1)], dtype=np.object_)
>>> a.item() #return np.int64
np.int64(1)
- itemsize
Length of one array element in bytes.
Examples
>>> import numpy as np
>>> x = np.array([1,2,3], dtype=np.float64)
>>> x.itemsize
8
>>> x = np.array([1,2,3], dtype=np.complex128)
>>> x.itemsize
16
- mT
View of the matrix transposed array.
The matrix transpose is the transpose of the last two dimensions, even if the array is of higher dimension.
Added in version 2.0.
- Raises:
- ValueError
If the array is of dimension less than 2.
Examples
>>> import numpy as np
>>> a = np.array([[1, 2], [3, 4]])
>>> a
array([[1, 2],
       [3, 4]])
>>> a.mT
array([[1, 3],
       [2, 4]])
>>> a = np.arange(8).reshape((2, 2, 2))
>>> a
array([[[0, 1],
        [2, 3]],

       [[4, 5],
        [6, 7]]])
>>> a.mT
array([[[0, 2],
        [1, 3]],

       [[4, 6],
        [5, 7]]])
- max(axis=None, out=None, *, keepdims=<no value>, initial=<no value>, where=<no value>)
Return the maximum along a given axis.
Refer to numpy.amax for full documentation.
See also
numpy.amaxequivalent function
- mean(axis=None, dtype=None, out=None, *, keepdims=<no value>, where=<no value>)
Returns the average of the array elements along given axis.
Refer to numpy.mean for full documentation.
See also
numpy.meanequivalent function
- merge(others, axis=1, isort=None, missing=None)
Merges dataArrays to self !!NOT in place!!
and add attributes from others according to parameter
missing. Like concatenate but cares about isort and attributes.- Parameters:
- othersdataArray, dataList, list of dataArray
Objects to concatenate with same shape as self.
- axisinteger
Axis along to concatenate. Default concatenates along X. None flattens the dataArray before merge. See numpy.concatenate.
- isortinteger
Sort array along column isort =i
- missingNone, ‘error’, ‘drop’, ‘skip’. ‘first’, default=None
- Determines how to deal with missing attributes.
Insert none
Raise AttributeError
‘drop’ attribute value for missing
‘skip’ attribute for all
Use ‘first’ one
- Returns:
- dataArray with merged attributes
Examples
import jscatter as js
import numpy as np

x = np.r_[0:10]
data0 = js.dA(np.c_[x, x**2].T)
data1 = js.dA(np.c_[x+0.5, x**2].T)
all = data0.merge(data1)
- min(axis=None, out=None, *, keepdims=<no value>, initial=<no value>, where=<no value>)
Return the minimum along a given axis.
Refer to numpy.amin for full documentation.
See also
numpy.aminequivalent function
- modelValues(*args, **kwargs)
Calculates modelValues after a fit allowing simulation with changed parameters.
- nakedCopy()
Deepcopy without attributes, thus only the data.
- property name
name, mainly the filename of read data files.
- nbytes
Total bytes consumed by the elements of the array.
See also
sys.getsizeofMemory consumed by the object itself without parents in case view. This does include memory consumed by non-element attributes.
Notes
Does not include memory consumed by non-element attributes of the array object.
Examples
>>> import numpy as np
>>> x = np.zeros((3,5,2), dtype=np.complex128)
>>> x.nbytes
480
>>> np.prod(x.shape) * x.itemsize
480
- ndim
Number of array dimensions.
Examples
>>> import numpy as np
>>> x = np.array([1, 2, 3])
>>> x.ndim
1
>>> y = np.zeros((2, 3, 4))
>>> y.ndim
3
- nonzero()
Return the indices of the elements that are non-zero.
Refer to numpy.nonzero for full documentation.
See also
numpy.nonzeroequivalent function
- partition(kth, axis=-1, kind='introselect', order=None)
Partially sorts the elements in the array in such a way that the value of the element in k-th position is in the position it would be in a sorted array. In the output array, all elements smaller than the k-th element are located to the left of this element and all equal or greater are located to its right. The ordering of the elements in the two partitions on the either side of the k-th element in the output array is undefined.
- Parameters:
- kthint or sequence of ints
Element index to partition by. The kth element value will be in its final sorted position and all smaller elements will be moved before it and all equal or greater elements behind it. The order of all elements in the partitions is undefined. If provided with a sequence of kth it will partition all elements indexed by kth of them into their sorted position at once.
Deprecated since version 1.22.0: Passing booleans as index is deprecated.
- axisint, optional
Axis along which to sort. Default is -1, which means sort along the last axis.
- kind{‘introselect’}, optional
Selection algorithm. Default is ‘introselect’.
- orderstr or list of str, optional
When a is an array with fields defined, this argument specifies which fields to compare first, second, etc. A single field can be specified as a string, and not all fields need to be specified, but unspecified fields will still be used, in the order in which they come up in the dtype, to break ties.
See also
numpy.partitionReturn a partitioned copy of an array.
argpartitionIndirect partition.
sortFull sort.
Notes
See
np.partitionfor notes on the different algorithms.Examples
>>> import numpy as np
>>> a = np.array([3, 4, 2, 1])
>>> a.partition(3)
>>> a
array([2, 1, 3, 4]) # may vary
>>> a.partition((1, 3))
>>> a
array([1, 2, 3, 4])
- polyfit(X=None, deg=1, function=None, efunction=None, col=None)
Inter(extra)polated values for column using a polyfit.
Extrapolation is done by using a polynominal fit over all Y with weights eY. To get the correct result the output needs to be evaluated by the inverse of function (if used). Other columns can be used without weight.
- Parameters:
- Xarraylike
X values where to calculate Y If None then X=self.X e.g. for smoothing/extrapolation.
- degint
Degree of polynom used for interpolation see numpy.polyfit
- functionfunction or lambda
Used prior to polyfit as polyfit( function(Y) )
- efunctionfunction or lambda
Used prior to polyfit for eY as weights = efunction(eY) efunction should be built according to error propagation.
- colstring, int
Which column to interpolate. Default is ‘Y’. Can be index number, columnname or in [‘X’,’Y’,’eY’,…].
- Returns:
- dataArray
Examples
Examples assumes exp decaying data (diffusion). To fit a linear function in the exponent we use log before fitting of the polyfit. Later we recover the data using the inverse function (exp).
import jscatter as js
import numpy as np
t = np.r_[0:100:10]
q=0.5
D=0.2
data = js.dA(np.c_[t, np.exp(-q**2*D*t)].T)
pf=data.polyfit(np.r_[0:100], deg=1, function=np.log)
p=js.grace()
p.plot(data,le='original')
p.plot(pf.X,np.exp(pf.Y),sy=[1,0.1,2],le='polyfit data')
p.yaxis(scale='log')
p.legend(x=10,y=0.1)
- prod(axis=None, dtype=None, out=None, *, keepdims=<no value>, initial=<no value>, where=<no value>)
Return the product of the array elements over the given axis
Refer to numpy.prod for full documentation.
See also
numpy.prodequivalent function
- prune(lower=None, upper=None, number=None, kind='lin', col='X', weight='eY', keep=None, type='mean', fillvalue=None)
Reduce number of values between upper and lower limits by selection or averaging in intervals.
Reduces dataArrays size. New values may be determined as next value, average in intervals, sum in intervals or by selection.
- Parameters:
- lowerfloat
Lower bound
- upperfloat
Upper bound
- numberint
Number of points between [lower,upper] resulting in number intervals.
- kind‘log’, ‘-log’, ‘lin’, ‘unique’, array, default ‘lin’
Determines how new points were distributed.
explicit list/array of new values as [1,2,3,4,5] :
Interval borders were chosen in center between consecutive values. Outside border values are symmetric to inside.
number, upper, lower are ignored.
The value in column specified by col is the average found in the interval.
The explicit values given can be set after using prune for the column given in col.
‘unique’ explicit list of unique values is used.
Can be used to reduce multiple equal X values to averages keeping original X.
‘log’ : Closest values in log distribution with number points in [lower,upper].
- ‘-log’Same as ‘log’ but repeat for negative side doubling number of points.
Intervals are [lower,0[ and ]0,upper] including [0].
‘lin’ : Closest values in lin distribution with number points in [lower,upper]
If number is None all points between [lower,upper] are used.
- type{‘next’,’mean’,’error’,’mean+error’,’sum’} default ‘mean’
How to determine the value for a new point.
‘sum’ : Sum in intervals. The col column will show the average (=sum/numberofvalues). The last column contains the number of summed values.
‘mean’ : mean values in interval; Give weight to get a weigthed mean.
‘mean+std’ : Calc mean and add error columns as standard deviation in intervals. Give weight to get a weigthed mean. Can be used if no errors are present to generate errors as std in intervals. For single or keep values the error is interpolated from neighboring values.
! For less pruned data error may be bad defined if only a few points are averaged.
- col‘X’,’Y’….., or int, default ‘X’
Column to prune along X,Y,Z or index of column.
- weightNone, protectedNames as ‘eY’ or int
Column of errors=w for weight as 1/w² in ‘mean’ calculation. Weight column gets finally new error \((\sum_i(1/w_i^2))^{-0.5}\)
None is equal weight
If weight not existing or contains zeros equal weights are used.
- keeplist of int
List of indices to keep in any case e.g. keep=np.r_[0:10,90:101]. Missing error values for type=’mean+error’ are interpolated.
- fillvaluefloat, ‘remove’, ‘interp’, default=’remove’
Fillvalue for empty intervals.
float: explicit value
‘remove’: removes empty interval
‘interp’: interpolate missing values by linear interpolation.
- Returns:
- dataArray with values pruned to number values.
Notes
Attention !!!!
Dependent on the distribution of points a lower number of new points can result for fillvalue=’remove’. e.g. think of noisy data between 4 and 5 and a lin distribution from 1 to 10 of 9 points as there are no data between 5 and 10 these will all result in 5 and be set to 5 to be unique.
Above also applies to ‘log’ scales if in intervals points are missing in particular close to zero.
For asymmetric distribution of points in the intervals or at intervals at the edges the pruned points might be different than naively expected, specifically not being equidistant relative to neighboring points. To force the points of col set these explicitly.
Examples
import jscatter as js
import numpy as np
x=np.r_[0:10:0.01]
data=js.dA(np.c_[x,np.sin(x)+0.2*np.random.randn(len(x)),x*0+0.2].T)  # simulate data with error
p=js.grace()
p.plot(data,le='original',sy=[1,0.3,11])
p.plot(data.prune(lower=1,upper=5,number=100,type='mean+'),le='mean')
p.plot(data.prune(lower=5,upper=8,number=100,type='mean+',keep=np.r_[1:50]),le='mean+keep')
p.plot(data.prune(lower=1,upper=10,number=40,type='mean+',kind='log'),sy=[1,0.5,5],le='log')
p.plot(data.prune(lower=8).prune(number=10,col='Y'),sy=[1,0.5,7],le='Y prune')
p.legend(x=0,y=-1)
# p.save(js.examples.imagepath+'/prune.jpg')

- put(indices, values, mode='raise')
Set
a.flat[n] = values[n]for allnin indices.Refer to numpy.put for full documentation.
See also
numpy.putequivalent function
- ravel(order='C')
Return a flattened array.
Refer to numpy.ravel for full documentation.
See also
numpy.ravelequivalent function
ndarray.flata flat iterator on the array.
- real
The real part of the array.
Usually returns a view into the original array, but returns elementwise
.realfor arrays of objects.See also
numpy.realequivalent function
Examples
>>> import numpy as np
>>> x = np.sqrt([1+0j, 0+1j])
>>> x.real
array([ 1.        ,  0.70710678])
>>> x.real.dtype
dtype('float64')
- refineFit(method='lm', **kw)
Refined fit with starting values from previous fit.
Examples
import jscatter as js
import numpy as np
data=js.dA(js.examples.datapath+'/iqt_1hho.dat',index=3)
diffusion=lambda t,wavevector,A,D,b:A*np.exp(-wavevector**2*D*t)+b
data.fit(diffusion ,{'D':0.1,'A':1},{'b':0.},{'t':'X','wavevector':'q'},method='Powell')

data.refineFit()
- regrid(xgrid=None, zgrid=None, wgrid=None, method='nearest', fill_value=0)
Regrid multidimensional data to a regular grid with optional interpolation of .Y values for missing points.
E.g. 2D data (with .X .Z) are checked for missing points to get a regular grid (like image pixels) and .Y values are interpolated. By default, the unique values in a dimension are used but can be set by ?grid parameters. For 1D data use .interpolate
- Parameters:
- xgridarray,int, None
New grid in x dimension. If None the unique values in .X are used. For integer the xgrid with these number of points between [min(X),max(X)] is generated.
- zgrid :array,int, None
New grid in z dimension (second dimension). If None the unique values in .Z are used. For integer the zgrid with these number of points between [min(X),max(X)] is generated.
- wgrid :array, int, None
New grid in w dimension (3rd dimension). If None the unique values in .W are used. For integer the wgrid with these number of points between [min(X),max(X)] is generated. wgrid<2 ignores wgrid.
- methodfloat,’linear’, ‘nearest’, ‘cubic’
Filling value for new points as float or order of interpolation between existing points. See griddata
- fill_value
Value used to fill in for requested points outside of the convex hull of the input points. See griddata
- Returns:
- dataArray
Notes
Using unique values in any of the ?grids might create large arrays if close values differ by small values.
Examples
Read sasImage with masked areas. Reconstruct image by regrid which allows to interpolate the masked areas to get a full image. In the example calda might also be the result of a fit.
import jscatter as js
cal = js.sasimagelib.sasImage(js.examples.datapath+'/calibration.tiff')
# asdataArray removing masked areas
calda = cal.asdataArray(masked=None)
# regrid with image sasImageshape
# masked areas will be filled with nearest values
Y= calda.regrid(calda.qx,calda.qy,0).Y
#reshape to sasImageshape
Y.reshape([calda.sasImageshape[1],calda.sasImageshape[0]])
# show image
fig=js.mpl.contourImage(aa.T,axis='pixel',origin='upper')
The example repeats the griddata example
import jscatter as js
import numpy as np
import matplotlib.pyplot as pyplot
import matplotlib.tri as tri
def func(x, y):
    return x*(1-x)*np.cos(4*np.pi*x) * np.sin(4*np.pi*y**2)**2

# create random points in [0,1]
xz = np.random.rand(1000, 2)
v = func(xz[:,0], xz[:,1])
# create dataArray
data=js.dA(np.stack([xz[:,0], xz[:,1],v],axis=0),XYeYeX=[0, 2, None, None, 1, None])
fig0=js.mpl.scatter3d(data.X,data.Z,data.Y)
fig0.suptitle('original')

newdata=data.regrid(np.r_[0:1:100j],np.r_[0:1:200j],method='cubic')
fig1=js.mpl.surface(newdata.X,newdata.Z,newdata.Y)
fig1.suptitle('cubic')
pyplot.show(block=False)
- repeat(repeats, axis=None)
Repeat elements of an array.
Refer to numpy.repeat for full documentation.
See also
numpy.repeatequivalent function
- reshape(shape, /, *, order='C', copy=None) a.reshape(*shape, order='C', copy=None)
- reshape(*shape, order='C', copy=None) None
Returns an array containing the same data with a new shape.
Refer to numpy.reshape for full documentation.
See also
numpy.reshapeequivalent function
Notes
Unlike the free function numpy.reshape, this method on ndarray allows the elements of the shape parameter to be passed in as separate arguments. For example,
a.reshape(4, 2)is equivalent toa.reshape((4, 2)).
- resize(new_shape, /, *, refcheck=True) a.resize(*new_shape, refcheck=True)
- resize(*new_shape, refcheck=True) None
Change shape and size of array in-place.
- Parameters:
- new_shapetuple of ints, or n ints
Shape of resized array.
- refcheckbool, optional
If False, reference count will not be checked. Default is True. See Notes below for more explanation.
- Returns:
- None
- Raises:
- ValueError
If a does not own its own data or references or views to may exist.
See also
resizeReturn a new array with the specified shape.
Notes
This reallocates space for the data area if necessary.
Only contiguous arrays (data elements consecutive in memory) can be resized.
Reallocating arrays in-place can often lead to memory fragmentation and should be avoided. If the goal is to reclaim over-allocated memory, alternatives are to create a view or a copy of just the desired data, or using two passes to build the array: one to cheaply determine the shape and another to allocate and fill. Benchmark your use case to determine what is optimum. You may be surprised to find
resizeactually slows down or bloats your application.The purpose of the reference count check is to make sure you do not use this array as a buffer for another Python object and then reallocate the memory.
On Python 3.13 and older, the check allows objects with exactly one reference to be reallocated in-place. On Python 3.14 and newer, the array must be uniquely referenced. See [1] for more details.
If you are sure that you have not shared the memory for this array with another Python object, then you may safely set refcheck to False.
References
[1]Python 3.14 What’s New, https://docs.python.org/3/whatsnew/3.14.html#whatsnew314-refcount
Examples
Shrinking an array: array is flattened (in the order that the data are stored in memory), resized, and reshaped:
>>> import numpy as np
>>> a = np.array([[0, 1], [2, 3]], order='C')
>>> a.resize((2, 1))
>>> a
array([[0],
       [1]])
>>> a = np.array([[0, 1], [2, 3]], order='F')
>>> a.resize((2, 1))
>>> a
array([[0],
       [2]])
Enlarging an array: as above, but missing entries are filled with zeros:
>>> b = np.array([[0, 1], [2, 3]])
>>> b.resize(2, 3) # new_shape parameter doesn't have to be a tuple
>>> b
array([[0, 1, 2],
       [3, 0, 0]])
Referencing an array prevents resizing…
>>> c = a
>>> a.resize((1, 1))
Traceback (most recent call last):
...
ValueError: cannot resize an array that references or is referenced ...
Unless refcheck is False:
>>> a.resize((1, 1), refcheck=False)
>>> a
array([[0]])
>>> c
array([[0]])
- resumeAttrTxt(names=None, maxlength=None)
Resume attributes in text form.
A list with the first element of each attr is converted to string.
- Parameters:
- namesiterable
Names in attributes to use
- maxlengthinteger
Max length of string
- Returns:
- string
- round(decimals=0, out=None)
Return a with each element rounded to the given number of decimals.
Refer to numpy.around for full documentation.
See also
numpy.aroundequivalent function
- save(name, fmt='%8.5e', exclude=[])
Saves dataArray in ASCII text file (optional gzipped).
If name extension is ‘.gz’ the file is compressed (gzip).
For writing format see
dataList.savetxt()
- Parameters:
- namestring, stringIO
Filename to write to or io.BytesIO.
- excludelist of str, default []
List of attribute names to exclude from being saved.
exclude = [‘XYeYeX’] excludes the specific lines to recover columnIndex (“XYeYeX 1 2 3 - - - -“).
To exclude all attributes exclude = data.attr
- fmtstring
Format specifier for float.
passed to numpy.savetext with example for ndarray part:
A single format (%10.5f), a sequence of formats or a multi-format string, e.g. ‘Iteration %d – %10.5f’, in which
case delimiter is ignored.
- savetext(name, fmt='%8.5e', exclude=[])
Saves dataArray in ASCII text file (optional gzipped).
If name extension is ‘.gz’ the file is compressed (gzip).
For writing format see
dataList.savetxt()
- Parameters:
- namestring, stringIO
Filename to write to or io.BytesIO.
- excludelist of str, default []
List of attribute names to exclude from being saved.
exclude = [‘XYeYeX’] excludes the specific lines to recover columnIndex (“XYeYeX 1 2 3 - - - -“).
To exclude all attributes exclude = data.attr
- fmtstring
Format specifier for float.
passed to numpy.savetext with example for ndarray part:
A single format (%10.5f), a sequence of formats or a multi-format string, e.g. ‘Iteration %d – %10.5f’, in which
case delimiter is ignored.
- savetxt(name, fmt='%8.5e', exclude=[])
Saves dataArray in ASCII text file (optional gzipped).
If name extension is ‘.gz’ the file is compressed (gzip).
For writing format see
dataList.savetxt()
- Parameters:
- namestring, stringIO
Filename to write to or io.BytesIO.
- excludelist of str, default []
List of attribute names to exclude from being saved.
exclude = [‘XYeYeX’] excludes the specific lines to recover columnIndex (“XYeYeX 1 2 3 - - - -“).
To exclude all attributes exclude = data.attr
- fmtstring
Format specifier for float.
passed to numpy.savetext with example for ndarray part:
A single format (%10.5f), a sequence of formats or a multi-format string, e.g. ‘Iteration %d – %10.5f’, in which
case delimiter is ignored.
- searchsorted(v, side='left', sorter=None)
Find indices where elements of v should be inserted in a to maintain order.
For full documentation, see numpy.searchsorted.
See also
numpy.searchsortedequivalent function
- setColumnIndex(*args, **kwargs)
Set the column index where to find X,Y,Z,W, eY, eX, eZ
- Parameters:
- ix,iy,iey,iex,iz,iez,iw,iewinteger, None
- Set column index, where to find X, Y, eY.
Default from initialization is
ix,iy,iey,iex,iz,iez,iw,iew=0,1,2,None,None,None,None,None. (Usability wins iey=2!!)If dataArray is given the ColumnIndex is copied, everything else is ignored. Negative indices stay as they are if the number of columns is different.
If list [0,1,3] is given these are used as [ix,iy,iey,iex,iz,iez,iw,iew].
Remember that negative indices always are counted from back.
Notes
integer: column index, values outside range are treated like None.
None,’-’: reset as not used e.g.iex=None -> no errors for x
Anything else is ignored.
Take care that negative integers as -1 is counted from the back.
For array.ndim=1 -> ix=0 and others=None as default.
Examples
data.setColumnIndex(ix=2,iy=3,iey=0,iex=None)
# remove y error in (only needed if 3rd column present)
data.setColumnIndex(iey=None)
# add Z, W column  for 3D data
data.setColumnIndex(ix=0, iz=1, iw=2, iy=3)
- setConstrain(*args)
Set constrains for constrained minimization in fit.
Inequality constrains are accounted by an exterior penalty function increasing chi2. Equality constrains should be incorporated in the model function to reduce the number of parameters.
- Parameters:
- argsfunction or lambda function
Function that defines constrains by returning boolean with free and fixed parameters as input. The constrain function should return True in the accepted region and return False otherwise. Without function all constrains are removed.
Notes
See dataList
- setLimit(*args, **kwargs)
Set upper and lower limits for parameters in the least square fit.
- setattr(objekt, prepend='', keyadd='_')
Set (copy) attributes from objekt.
- Parameters:
- objektobjekt or dictionary
Can be a dictionary of names:value pairs like {‘name’:[1,2,3,7,9]} If object is dataArray the attributes from dataArray.attr are copied
- prependstring, default ‘’
Prepend this string to all attribute names.
- keyaddchar, default=’_’
If reserved attributes (T, mean, ..) are found the name is ‘T’+keyadd
- setfield(val, dtype, offset=0)
Put a value into a specified place in a field defined by a data-type.
Place val into a’s field defined by dtype and beginning offset bytes into the field.
- Parameters:
- valobject
Value to be placed in field.
- dtypedtype object
Data-type of the field in which to place val.
- offsetint, optional
The number of bytes into the field at which to place val.
- Returns:
- None
See also
Examples
>>> import numpy as np
>>> x = np.eye(3)
>>> x.getfield(np.float64)
array([[1.,  0.,  0.],
       [0.,  1.,  0.],
       [0.,  0.,  1.]])
>>> x.setfield(3, np.int32)
>>> x.getfield(np.int32)
array([[3, 3, 3],
       [3, 3, 3],
       [3, 3, 3]], dtype=int32)
>>> x
array([[1.0e+000, 1.5e-323, 1.5e-323],
       [1.5e-323, 1.0e+000, 1.5e-323],
       [1.5e-323, 1.5e-323, 1.0e+000]])
>>> x.setfield(np.eye(3), np.int32)
>>> x
array([[1.,  0.,  0.],
       [0.,  1.,  0.],
       [0.,  0.,  1.]])
- setflags(write=None, align=None, uic=None)
Set array flags WRITEABLE, ALIGNED, WRITEBACKIFCOPY, respectively.
These Boolean-valued flags affect how numpy interprets the memory area used by a (see Notes below). The ALIGNED flag can only be set to True if the data is actually aligned according to the type. The WRITEBACKIFCOPY flag can never be set to True. The flag WRITEABLE can only be set to True if the array owns its own memory, or the ultimate owner of the memory exposes a writeable buffer interface, or is a string. (The exception for string is made so that unpickling can be done without copying memory.)
- Parameters:
- writebool, optional
Describes whether or not a can be written to.
- alignbool, optional
Describes whether or not a is aligned properly for its type.
- uicbool, optional
Describes whether or not a is a copy of another “base” array.
Notes
Array flags provide information about how the memory area used for the array is to be interpreted. There are 7 Boolean flags in use, only three of which can be changed by the user: WRITEBACKIFCOPY, WRITEABLE, and ALIGNED.
WRITEABLE (W) the data area can be written to;
ALIGNED (A) the data and strides are aligned appropriately for the hardware (as determined by the compiler);
WRITEBACKIFCOPY (X) this array is a copy of some other array (referenced by .base). When the C-API function PyArray_ResolveWritebackIfCopy is called, the base array will be updated with the contents of this array.
All flags can be accessed using the single (upper case) letter as well as the full name.
Examples
>>> import numpy as np
>>> y = np.array([[3, 1, 7],
...               [2, 0, 0],
...               [8, 5, 9]])
>>> y
array([[3, 1, 7],
       [2, 0, 0],
       [8, 5, 9]])
>>> y.flags
  C_CONTIGUOUS : True
  F_CONTIGUOUS : False
  OWNDATA : True
  WRITEABLE : True
  ALIGNED : True
  WRITEBACKIFCOPY : False
>>> y.setflags(write=0, align=0)
>>> y.flags
  C_CONTIGUOUS : True
  F_CONTIGUOUS : False
  OWNDATA : True
  WRITEABLE : False
  ALIGNED : False
  WRITEBACKIFCOPY : False
>>> y.setflags(uic=1)
Traceback (most recent call last):
  File "<stdin>", line 1, in <module>
ValueError: cannot set WRITEBACKIFCOPY flag to True
- setlimit(*args, **kwargs)
Set upper and lower limits for parameters in the least square fit.
- shape
Tuple of array dimensions.
The shape property is usually used to get the current shape of an array, but may also be used to reshape the array in-place by assigning a tuple of array dimensions to it. As with numpy.reshape, one of the new shape dimensions can be -1, in which case its value is inferred from the size of the array and the remaining dimensions. Reshaping an array in-place will fail if a copy is required.
Warning
Setting
arr.shapeis deprecated and may be removed in the future. Using ndarray.reshape is the preferred approach.See also
numpy.shapeEquivalent getter function.
numpy.reshapeFunction similar to setting
shape.ndarray.reshapeMethod similar to setting
shape.
Examples
>>> import numpy as np
>>> x = np.array([1, 2, 3, 4])
>>> x.shape
(4,)
>>> y = np.zeros((2, 3, 4))
>>> y.shape
(2, 3, 4)
- showattr(maxlength=None, exclude=['comment'])
Show attributes with values as overview.
- Parameters:
- maxlengthint
Truncate string representation after maxlength char
- excludelist of str
List of attr names to exclude from result
- simulate(**kwargs)
Simulate model results (showing errPlot but without fitting).
Simulate model and show in errPlot if one is open (use .makeErrPlot). Parameters can be set as in fit (using fixpar,freepar dict) or like calling a function (parameter=value).
- Parameters:
- modelfunction
The model to evaluate. See .fit. If not given the last used fit model is tried.
- mapNamesdict, required
Map parameter names from model to attribute names in data e.g. {‘t’:’X’,’wavevector’:’q’}
- args, kwargs
Keyword arguments to pass to model or for plotting (same as in fit method).
- Returns:
- ModelValuesdataList or dataArray
Examples
import numpy as np
import jscatter as js

i5=js.dL(js.examples.datapath+'/iqt_1hho.dat')
diffusion=lambda A,D,t,elastic,wavevector=0:(A-elastic)*np.exp(-wavevector**2*D*t)+elastic
diffusion2=lambda A,D,t,elastic,wavevector=0:A*np.exp(-wavevector**2*D*t)+elastic + 1

# like .fit
sim = i5.simulate(model=diffusion,freepar={'D':0.2,'A':1}, fixpar={'elastic':0.0},
           mapNames= {'t':'X','wavevector':'q'},  condition=lambda a:a.X>0.01  )

# like calling a function
sim = i5.simulate(model=diffusion2, elastic=0.0, A=1, D=0.2,  mapNames= {'t':'X','wavevector':'q'})

i5.makeErrPlot()
i5.fit(model=diffusion,freepar={'D':0.2,'A':1}, fixpar={'elastic':0.0},
      mapNames= {'t':'X','wavevector':'q'},  condition=lambda a:a.X>0.01  )

simulatedValues = i5.simulate(D=i5.lastfit.D*2)
simulatedValues1 = i5.simulate(elastic=0.1)
- size
Number of elements in the array.
Equal to
np.prod(a.shape), i.e., the product of the array’s dimensions.Notes
a.size returns a standard arbitrary precision Python integer. This may not be the case with other methods of obtaining the same value (like the suggested
np.prod(a.shape), which returns an instance ofnp.int_), and may be relevant if the value is used further in calculations that may overflow a fixed size integer type.Examples
>>> import numpy as np
>>> x = np.zeros((3, 5, 2), dtype=np.complex128)
>>> x.size
30
>>> np.prod(x.shape)
30
- sort(axis=-1, kind=None, order=None, *, stable=None, descending=None)
Sort an array in-place. Refer to numpy.sort for full documentation.
- Parameters:
- axisint, optional
Axis along which to sort. Default is -1, which means sort along the last axis.
- kind{‘quicksort’, ‘mergesort’, ‘heapsort’, ‘stable’}, optional
Sorting algorithm. The default is ‘quicksort’. Note that both ‘stable’ and ‘mergesort’ use timsort under the covers and, in general, the actual implementation will vary with datatype. The ‘mergesort’ option is retained for backwards compatibility.
- orderstr or list of str, optional
When a is an array with fields defined, this argument specifies which fields to compare first, second, etc. A single field can be specified as a string, and not all fields need be specified, but unspecified fields will still be used, in the order in which they come up in the dtype, to break ties.
- stablebool, optional
Sort stability. If
True, the returned array will maintain the relative order ofavalues which compare as equal. IfFalseorNone, this is not guaranteed. Internally, this option selectskind='stable'. Default:None.Added in version 2.0.0.
See also
numpy.sortReturn a sorted copy of an array.
numpy.argsortIndirect sort.
numpy.lexsortIndirect stable sort on multiple keys.
numpy.searchsortedFind elements in sorted array.
numpy.partitionPartial sort.
Notes
See numpy.sort for notes on the different sorting algorithms.
Examples
>>> import numpy as np
>>> a = np.array([[1,4], [3,1]])
>>> a.sort(axis=1)
>>> a
array([[1, 4],
       [1, 3]])
>>> a.sort(axis=0)
>>> a
array([[1, 3],
       [1, 4]])
Use the order keyword to specify a field to use when sorting a structured array:
>>> a = np.array([('a', 2), ('c', 1)], dtype=[('x', 'S1'), ('y', int)])
>>> a.sort(order='y')
>>> a
array([(b'c', 1), (b'a', 2)],
      dtype=[('x', 'S1'), ('y', '<i8')])
- squeeze(axis=None)
Remove axes of length one from a.
Refer to numpy.squeeze for full documentation.
See also
numpy.squeezeequivalent function
- std(axis=None, dtype=None, out=None, ddof=0, *, keepdims=<no value>, where=<no value>, mean=<no value>)
Returns the standard deviation of the array elements along given axis.
Refer to numpy.std for full documentation.
See also
numpy.stdequivalent function
- sum(axis=None, dtype=None, out=None, *, keepdims=<no value>, initial=<no value>, where=<no value>)
Return the sum of the array elements over the given axis.
Refer to numpy.sum for full documentation.
See also
numpy.sumequivalent function
- swapaxes(axis1, axis2, /)
Return a view of the array with axis1 and axis2 interchanged.
Refer to numpy.swapaxes for full documentation.
See also
numpy.swapaxesequivalent function
- take(indices, axis=None, out=None, mode='raise')
Return an array formed from the elements of a at the given indices.
Refer to numpy.take for full documentation.
See also
numpy.takeequivalent function
- to_device(device, /, *, stream=None)
For Array API compatibility. Since NumPy only supports CPU arrays, this method is a no-op that returns the same array.
- Parameters:
- device“cpu”
Must be
"cpu".- streamNone, optional
Currently unsupported.
- Returns:
- outSelf
Returns the same array.
- tobytes(order='C')
Construct Python bytes containing the raw data bytes in the array.
Constructs Python bytes showing a copy of the raw contents of data memory. The bytes object is produced in C-order by default. This behavior is controlled by the
orderparameter.- Parameters:
- order{‘C’, ‘F’, ‘A’}, optional
Controls the memory layout of the bytes object. ‘C’ means C-order, ‘F’ means F-order, ‘A’ (short for Any) means ‘F’ if a is Fortran contiguous, ‘C’ otherwise. Default is ‘C’.
- Returns:
- sbytes
Python bytes exhibiting a copy of a’s raw data.
See also
frombufferInverse of this operation, construct a 1-dimensional array from Python bytes.
Examples
>>> import numpy as np
>>> x = np.array([[0, 1], [2, 3]], dtype='<u2')
>>> x.tobytes()
b'\x00\x00\x01\x00\x02\x00\x03\x00'
>>> x.tobytes('C') == x.tobytes()
True
>>> x.tobytes('F')
b'\x00\x00\x02\x00\x01\x00\x03\x00'
- tofile(fid, /, sep='', format='%s')
Write array to a file as text or binary (default).
Data is always written in ‘C’ order, independent of the order of a. The data produced by this method can be recovered using the function fromfile().
- Parameters:
- fidfile or str or Path
An open file object, or a string containing a filename.
- sepstr
Separator between array items for text output. If “” (empty), a binary file is written, equivalent to
file.write(a.tobytes()).- formatstr
Format string for text file output. Each entry in the array is formatted to text by first converting it to the closest Python type, and then using “format” % item.
Notes
This is a convenience function for quick storage of array data. Information on endianness and precision is lost, so this method is not a good choice for files intended to archive data or transport data between machines with different endianness. Some of these problems can be overcome by outputting the data as text files, at the expense of speed and file size.
When fid is a file object, array contents are directly written to the file, bypassing the file object’s
writemethod. As a result, tofile cannot be used with files objects supporting compression (e.g., GzipFile) or file-like objects that do not supportfileno()(e.g., BytesIO).
- tolist()
Return the array as an
a.ndim-levels deep nested list of Python scalars.Return a copy of the array data as a (nested) Python list. Data items are converted to the nearest compatible builtin Python type, via the ~numpy.ndarray.item method.
If
a.ndimis 0, then since the depth of the nested list is 0, it will not be a list at all, but a simple Python scalar.- Parameters:
- none
- Returns:
- yobject, or list of object, or list of list of object, or …
The possibly nested list of array elements.
Notes
The array may be recreated via
a = np.array(a.tolist()), although this may sometimes lose precision.Examples
For a 1D array,
a.tolist()is almost the same aslist(a), except thattolistchanges numpy scalars to Python scalars:>>> import numpy as np >>> a = np.uint32([1, 2]) >>> a_list = list(a) >>> a_list [np.uint32(1), np.uint32(2)] >>> type(a_list[0]) <class 'numpy.uint32'> >>> a_tolist = a.tolist() >>> a_tolist [1, 2] >>> type(a_tolist[0]) <class 'int'>
Additionally, for a 2D array,
tolistapplies recursively:>>> a = np.array([[1, 2], [3, 4]]) >>> list(a) [array([1, 2]), array([3, 4])] >>> a.tolist() [[1, 2], [3, 4]]
The base case for this recursion is a 0D array:
>>> a = np.array(1)
>>> list(a)
Traceback (most recent call last):
  ...
TypeError: iteration over a 0-d array
>>> a.tolist()
1
- trace(offset=0, axis1=0, axis2=1, dtype=None, out=None)
Return the sum along diagonals of the array.
Refer to numpy.trace for full documentation.
See also
numpy.traceequivalent function
- transpose(*axes)
Returns a view of the array with axes transposed.
Refer to numpy.transpose for full documentation.
- Parameters:
- axesNone, tuple of ints, or n ints
None or no argument: reverses the order of the axes.
tuple of ints: i in the j-th place in the tuple means that the array’s i-th axis becomes the transposed array’s j-th axis.
n ints: same as an n-tuple of the same ints (this form is intended simply as a “convenience” alternative to the tuple form).
- Returns:
- pndarray
View of the array with its axes suitably permuted.
See also
transposeEquivalent function.
ndarray.TArray property returning the array transposed.
ndarray.reshapeReturn a reshaped ndarray without changing data.
Examples
>>> import numpy as np
>>> a = np.array([[1, 2], [3, 4]])
>>> a
array([[1, 2],
       [3, 4]])
>>> a.transpose()
array([[1, 3],
       [2, 4]])
>>> a.transpose((1, 0))
array([[1, 3],
       [2, 4]])
>>> a.transpose(1, 0)
array([[1, 3],
       [2, 4]])
>>> a = np.array([1, 2, 3, 4])
>>> a
array([1, 2, 3, 4])
>>> a.transpose()
array([1, 2, 3, 4])
- var(axis=None, dtype=None, out=None, ddof=0, *, keepdims=<no value>, where=<no value>, mean=<no value>)
Returns the variance of the array elements, along given axis.
Refer to numpy.var for full documentation.
See also
numpy.varequivalent function
- view([dtype][, type])
New view of array with the same data.
Note
Passing None for
dtypeis different from omitting the parameter, since the former invokesdtype(None)which is an alias fordtype(np.float64).- Parameters:
- dtypedata-type or ndarray sub-class, optional
Data-type descriptor of the returned view, e.g., float32 or int16. Omitting it results in the view having the same data-type as a. This argument can also be specified as an ndarray sub-class, which then specifies the type of the returned object (this is equivalent to setting the
typeparameter).- typePython type, optional
Type of the returned view, e.g., ndarray or matrix. Again, omission of the parameter results in type preservation.
Notes
a.view()is used two different ways:a.view(some_dtype)ora.view(dtype=some_dtype)constructs a view of the array’s memory with a different data-type. This can cause a reinterpretation of the bytes of memory.a.view(ndarray_subclass)ora.view(type=ndarray_subclass)just returns an instance of ndarray_subclass that looks at the same array (same shape, dtype, etc.) This does not cause a reinterpretation of the memory.For
a.view(some_dtype), ifsome_dtypehas a different number of bytes per entry than the previous dtype (for example, converting a regular array to a structured array), then the last axis ofamust be contiguous. This axis will be resized in the result.Changed in version 1.23.0: Only the last axis needs to be contiguous. Previously, the entire array had to be C-contiguous.
Examples
>>> import numpy as np
>>> x = np.array([(-1, 2)], dtype=[('a', np.int8), ('b', np.int8)])
Viewing array data using a different type and dtype:
>>> nonneg = np.dtype([("a", np.uint8), ("b", np.uint8)])
>>> y = x.view(dtype=nonneg, type=np.recarray)
>>> x["a"]
array([-1], dtype=int8)
>>> y.a
array([255], dtype=uint8)
Creating a view on a structured array so it can be used in calculations
>>> x = np.array([(1, 2),(3,4)], dtype=[('a', np.int8), ('b', np.int8)])
>>> xv = x.view(dtype=np.int8).reshape(-1,2)
>>> xv
array([[1, 2],
       [3, 4]], dtype=int8)
>>> xv.mean(0)
array([2.,  3.])
Making changes to the view changes the underlying array
>>> xv[0,1] = 20
>>> x
array([(1, 20), (3,  4)], dtype=[('a', 'i1'), ('b', 'i1')])
Using a view to convert an array to a recarray:
>>> z = x.view(np.recarray)
>>> z.a
array([1, 3], dtype=int8)
Views share data:
>>> x[0] = (9, 10)
>>> z[0]
np.record((9, 10), dtype=[('a', 'i1'), ('b', 'i1')])
Views that change the dtype size (bytes per entry) should normally be avoided on arrays defined by slices, transposes, fortran-ordering, etc.:
>>> x = np.array([[1, 2, 3], [4, 5, 6]], dtype=np.int16)
>>> y = x[:, ::2]
>>> y
array([[1, 3],
       [4, 6]], dtype=int16)
>>> y.view(dtype=[('width', np.int16), ('length', np.int16)])
Traceback (most recent call last):
    ...
ValueError: To change to a dtype of a different size, the last axis must be contiguous
>>> z = y.copy()
>>> z.view(dtype=[('width', np.int16), ('length', np.int16)])
array([[(1, 3)],
       [(4, 6)]], dtype=[('width', '<i2'), ('length', '<i2')])
However, views that change dtype are totally fine for arrays with a contiguous last axis, even if the rest of the axes are not C-contiguous:
>>> x = np.arange(2 * 3 * 4, dtype=np.int8).reshape(2, 3, 4)
>>> x.transpose(1, 0, 2).view(np.int16)
array([[[ 256,  770],
        [3340, 3854]],

       [[1284, 1798],
        [4368, 4882]],

       [[2312, 2826],
        [5396, 5910]]], dtype=int16)
- where(condition)
Copy with lines where condition is fulfilled.
- Parameters:
- conditionfunction
Function returning bool
Examples
data.where(lambda a:a.X>1)
data.where(lambda a:(a.X**2>1) & (a.Y>0.05)  )
- dataarray.zeros(**kwargs)
dataArray filled with zeros.
- Parameters:
- shapeinteger or tuple of integer
Shape of the new array, e.g., (2, 3) or 2.
- Returns:
- dataArray
Examples
js.zeros((3,20))
- dataarray.ones(**kwargs)
dataArray filled with ones.
- Parameters:
- shapeinteger or tuple of integer
Shape of the new array, e.g., (2, 3) or 2.
- Returns:
- dataArray
Examples
js.ones((3,20))
- dataarray.fromFunction(X, *args, **kwargs)
Evaluation of Y=function(X) for all X and returns a dataArray with X,Y
- Parameters:
- function or lambda
function to evaluate with first argument as X[i] result is flattened (to be one dimensional)
- Xarray N x M
X array function is evaluated along first dimension (N) e.g. np.linspace or np.logspace
- *args,**kwargsarguments passed to function
- Returns:
- dataArray with N x ndim(X)+ndim(function(X))
Examples
import jscatter as js
result=js.fromFunction(lambda x,n:[1,x,x**(2*n),x**(3*n)],np.linspace(1,50),2)
#
X=(np.linspace(0,30).repeat(3).reshape(-1,3)*np.r_[1,2,3])
result=js.fromFunction(lambda x:[1,x[0],x[1]**2,x[2]**3],X)
#
ff=lambda x,n,m:[1,x[0],x[1]**(2*n),x[2]**(3*m)]
X=(np.linspace(0,30).repeat(3).reshape(-1,3)*np.r_[1,2,3])
result1=js.fromFunction(ff,X,3,2)
result2=js.fromFunction(ff,X,m=3,n=2)
result1.showattr()
result2.showattr()